
FIGURE 6.
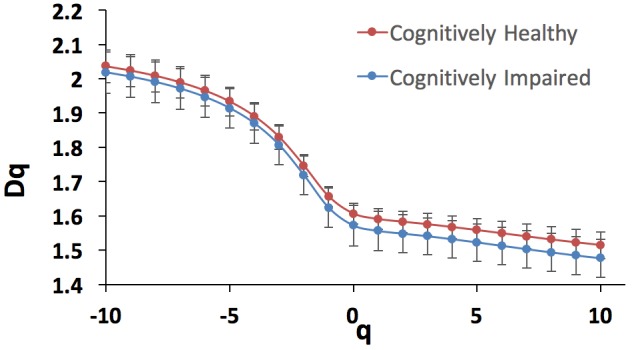
Generalized dimension spectrum Dq vs. q for the cognitively healthy individuals (n = 19, blue trace) and cognitively impaired (n = 20, red trace).
Official websites use .gov
A
.gov website belongs to an official
government organization in the United States.
Secure .gov websites use HTTPS
A lock (
) or https:// means you've safely
connected to the .gov website. Share sensitive
information only on official, secure websites.
Generalized dimension spectrum Dq vs. q for the cognitively healthy individuals (n = 19, blue trace) and cognitively impaired (n = 20, red trace).