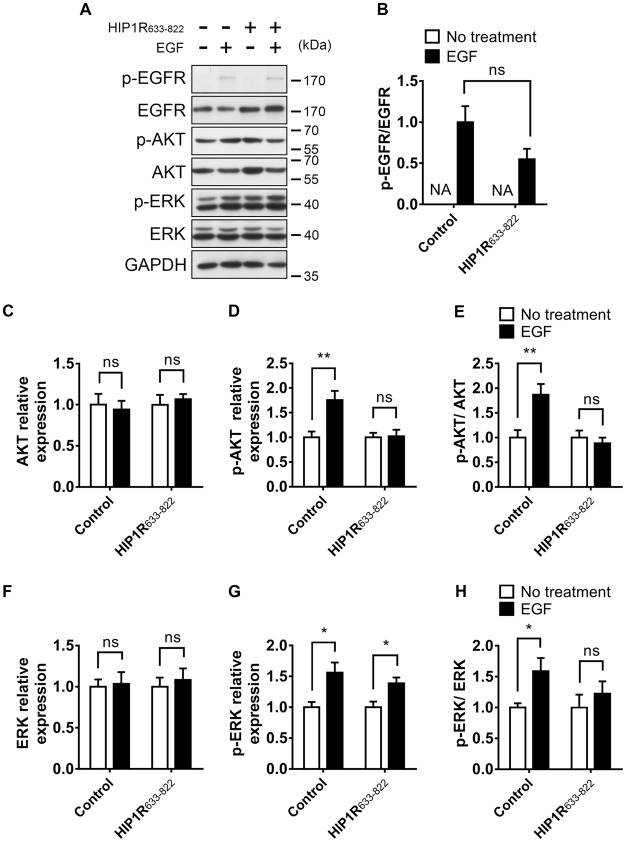
Figure 10.
Overexpression of HIP1R633–822 attenuates EGFR downstream signaling. (A) EGFR, Akt and ERK expression and phosphorylation with or without EGF treatment, in DIV 12 neurons. (B) Quantitative analysis of phosphorylated EGFR level. NA, not applicable. (C–E) Quantification of Akt (C), p-Akt (D) level and the p-Akt/Akt ratio (E). Normalized by GAPDH and compared with untreated control. (F–H) Quantification of ERK (F), p-ERK (G) level and the p-ERK/ERK ratio (H). Normalized by GAPDH and compared with untreated control. Mean ± SEM; ns, not significant; *p < 0.05; **p < 0.01; n = 3 independent experiments; unpaired two-tailed t-test.

