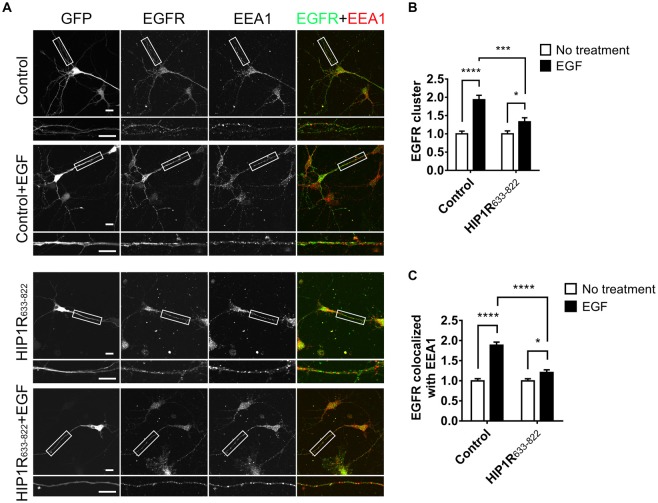
Figure 9.
HIP1R633–822 overexpression influences the internalization of EGFR. (A) Representative images of neurons electroporated with GFP or GFP-HIP1R633–822 constructs and treated with EGF for 15 min, labeled for GFP, EGFR and EEA1. Scale bar, 20 μm. (B,C) Quantification of EGFR clusters (B) and the colocalization of EGFR and EEA1 clusters (C) in control and HIP1R633–822 groups (n = 34 and 59 neurons for control groups, and 42 and 41 neurons for HIP1R633–822 groups). Mean ± SEM, *p < 0.05; ***p < 0.001; ****p < 0.0001; n = 3 independent cultures; unpaired two-tailed t-test.

