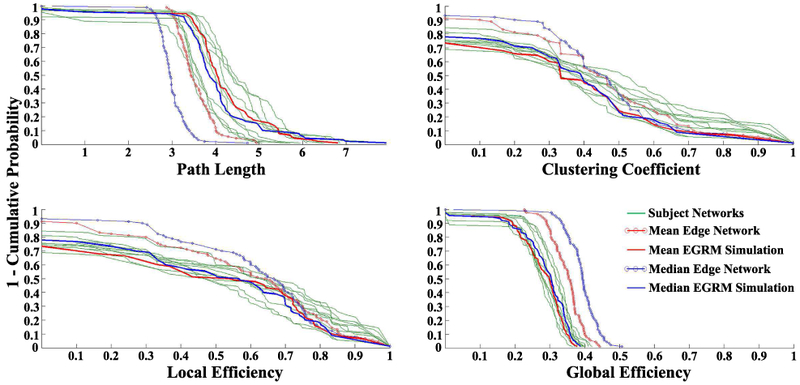
Figure 2.

Nodal distributions of path length, clustering coefficient, global efficiency, and local efficiency for the 10 participants NWs, mean and median correlation NWs, and most representative (mean and median) ERGM-based NWs. Reproduced from [30]. normalsize
