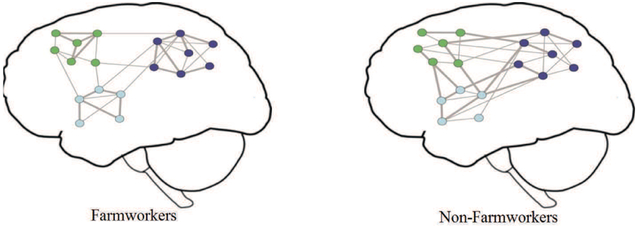
Figure 3.
Cartoon model of important differences found between the NWs of farmworkers and non-farmworkers. Each network node represents a brain region and the lines represent functional connections. The node color indicates the module membership and the edge thickness represents connection strength. The average connection probability (density) and strength are the same between farmworkers and non-farmworkers. However, brain NWs of farmworkers are more modularly organized and have higher functional specificity and lower inter-modular integrity when compared to non-farmworkers (stronger connections are shown with thicker edges). Reproduced from [56]. normalsize

