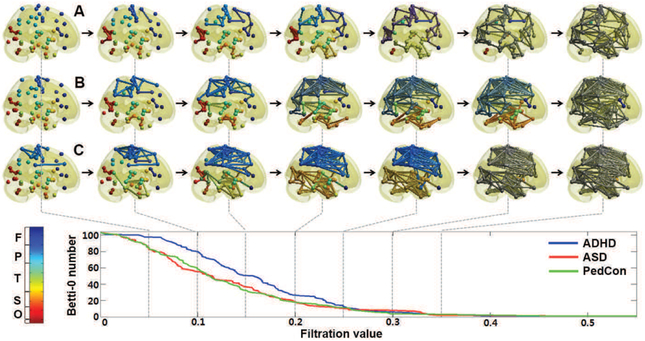
Figure 4.
Graph filtration of: (a) attention-deficit hyperactivity disorder (ADHD); (b) autism spectrum disorder (ASD); (c) pediatric controls (Ped-Con). As the filtration value on the horizontal axis increases the NW connections in each panel increase. Reprinted from [72]. normalsize

