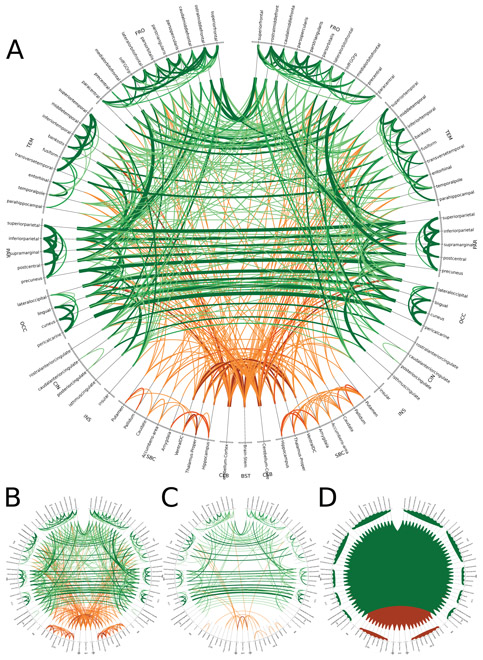
Figure 7.
Circos diagram of the repeated link detection from 80 SCoTMI NWs (A), using an 87 node Freesurfer parcellation of grey matter regions. Line width is proportional to the number of subjects with repeated detection of a particular link. Cortical links are green, subcortical links are orange. Comparison methods include sparse partial correlation (B), partial correlation (C), and linear correlation (D). normalsize

