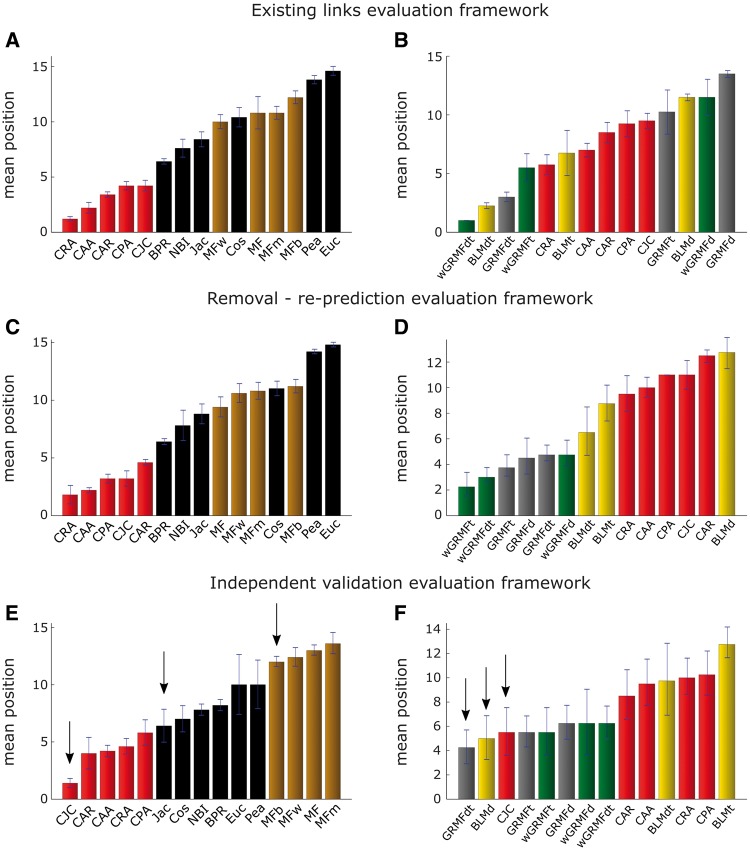
Figure 7.
Mean position ranking on drug–target prediction across all networks within the three evaluation frameworks. Mean position for each method in each evaluation framework over all networks. Each bar in the plot is ordered from the best (left) to the worst (right) method. On the left (A, C and E), comparison of three types of unsupervised methods: LCP-based, projection-based and MF-based. On the right (B, D and F), comparison of three types of supervised methods: BLM, GRMF and wGRMF with unsupervised LCP-based methods. The arrows point the methods selected for the comparison of drug–target prioritization in the first percentile.

