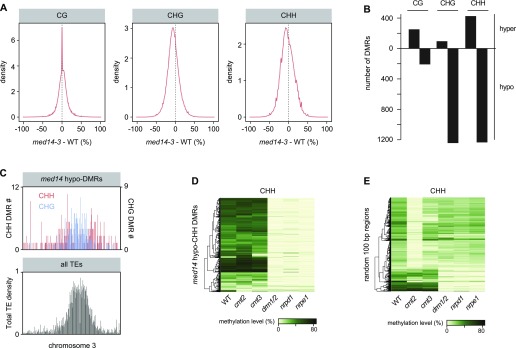
Figure 6. MED14 controls DNA methylation at CHG and CHH sites.
(A) Kernel density plot of DNA methylation differences between med14-3 and WT (L5 background) at CG, CHG, and CHH contexts. (B) Number of 100-bp differentially methylated regions (DMRs) detected in med14-3 at CG, CHG, and CHH contexts with a minimum DNA methylation difference of 0.4, 0.2, and 0.2, respectively. (C) Chromosomal density of hypo-CHG (blue) and hypo-CHH DMRs (red) identified in med14-3 (top) with total TE density in grey (bottom), both calculated by 100-kb windows on chromosome 3. (D) DNA methylation levels in the CHH context in the indicated genotypes at med14-3 hypo-CHH DMRs. (E) DNA methylation levels in the CHH context in the indicated genotypes at 1,200 randomly selected regions of 100 bp.

