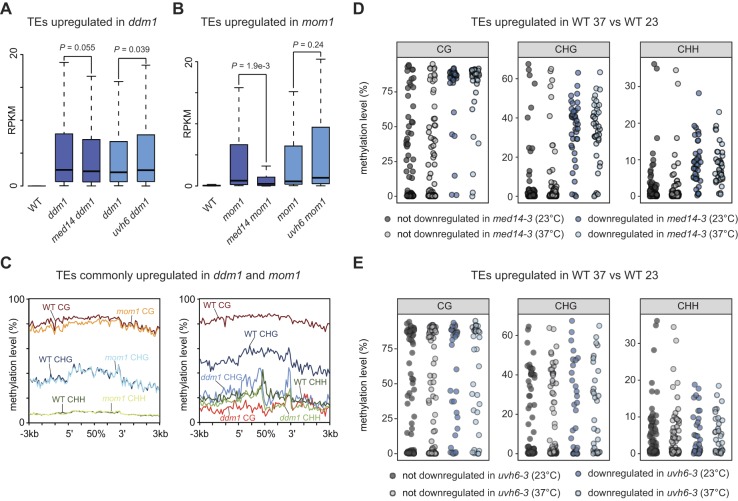
Figure S11. MED14 preferentially targets loci with high levels of DNA methylation to promote transcript accumulation.
(A, B) Reads per kilobase per million mapped reads (RPKM) values in WT (L5 background) and the indicated mutants of TEs up-regulated in ddm1 (A) or mom1 (B). Sister plants were identically colored. Statistical differences between distributions of single mutants (ddm1 and mom1) versus double mutants (med14 ddm1, uvh6 ddm1, med14 mom1, and uvh6 mom1) were tested using unpaired two-sided Mann–Whitney tests. (C) TEs commonly up-regulated in ddm1 and mom1 were aligned at their 5′-end or 3′-end, and average cytosine methylation levels in the indicated nucleotide contexts were calculated from 3 kb upstream to 3 kb downstream in WT, ddm1, and mom1. The upstream and downstream regions were divided in 100-bp bins, whereas annotations were divided in 40 bins of equal length. (D, E) DNA methylation levels in a WT at 23 or 37°C in the CG, CHG, and CHH contexts were calculated for TEs up-regulated in heat-stressed WT samples, distinguishing TEs down-regulated (blue) from TEs not down-regulated (grey) in med14-3 (D) or uvh6-3 (E) at 37°C relative to the WT at 37°C.

