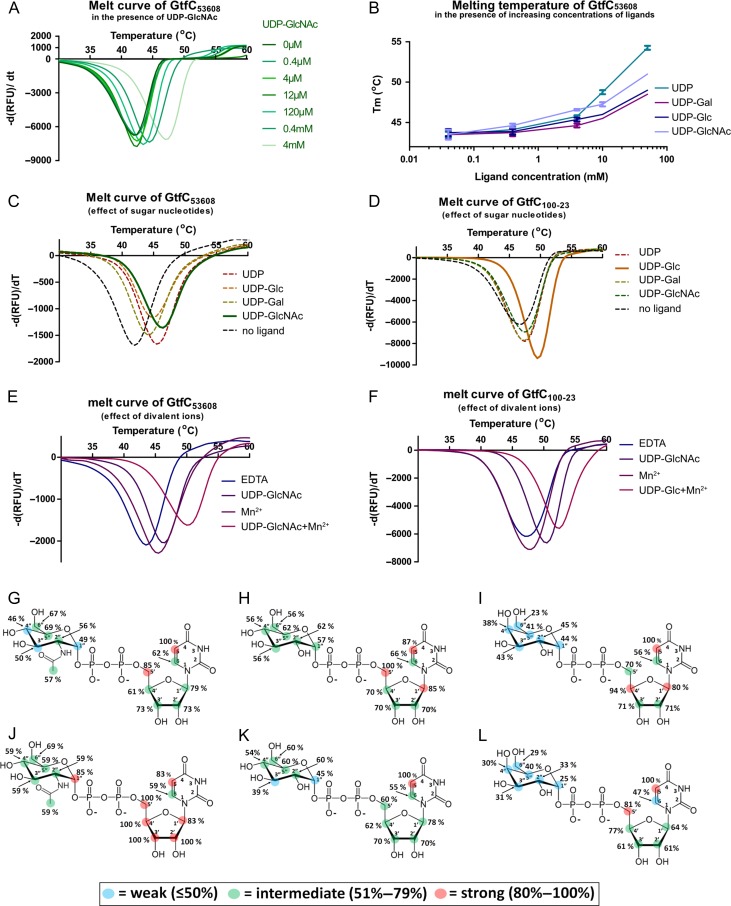
Fig. 6.
Analysis of GtfC100-23 and GtfC53608 ligand specificity. (A–F) Differential scanning fluorimetry (DSF) analysis. (A) Melt curve of GtfC53608 in the presence of increasing concentrations of UDP-GlcNAc. (B) Tm of GtfC53608 in the presence of increasing concentrations of UDP, UDP-Gal, UDP-Glc and UDP-GlcNAc. Error bars represent the standard error of the mean of four technical replicates. (C) Melt curve of GtfC53608 in the presence of 4 mM UDP-GlcNAc, UDP-Glc, UDP-Gal and UDP. (D) Melt curve of GtfC100-23C in the presence of 4 mM UDP-GlcNAc, UDP-Glc, UDP-Gal and UDP. (E) Melt curves of GtfC53608 in the presence of 5 mM Mn2+ (left), or 5 mM Mn2+ and 4 mM UDP-GlcNAc. (F) Melt curves of GtfC100-23C in the presence of 5 mM Mn2+ (left), or 5 mM Mn2+ and 4 mM UDP-Glc. Since no significant difference was observed between the different divalent ions, only Mn2+ is shown. (G–L) Saturation Transfer Difference (STD) NMR analysis. (G), (H), (I) Binding epitope maps for the complexes of GtfC100-23 with UDP-GlcNAc, UDP-Glc and UDP-Gal, respectively. Bottom row, (J), (K), (L) binding epitope maps for the complexes of GtfC53608 with UDP-GlcNAc, UDP-Glc and UDP-Gal, respectively. See also Table I and Figure S2 for the competition assays of the sugar nucleotides against GtfC100-23 and GtfC53608.

