
Table 4.
Adjusted Geometric Mean Length of Stay Stratified by Unit
| Unit | Coeflicient (SE) | Length of Stay, d, Geometric Mean (95% CI)a |
P Value |
|---|---|---|---|
| Academic B (n = 162) | |||
| Invasive device percentage | |||
| None | −0.378 (0.125) | 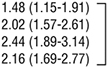 |
.002 |
| >0 to 35 | −0.068 (0.118) | ||
| >35 to 60 | 0.118 (0.126) | ||
| >60 | 1 [Reference] | ||
| Suctioning lapses | |||
| 0 | −0.474 (0.179) | 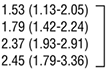 |
.002 |
| 1 | −0.316 (0.144) | ||
| 2 | −0.033 (0.148) | ||
| 3 or 4 | 1 [Reference] | ||
| Academic A (n = 326) | |||
| Invasive device percentage | |||
| None | −0.221 (0.092) | 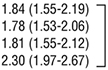 |
.004 |
| >0 to 35 | −0.255 (0.079) | ||
| >35 to 60 | −0.236 (0.080) | ||
| >60 | 1 [Reference] | ||
| Suctioning lapses | |||
| 0 | −0.421 (0.129) | 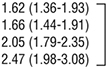 |
<.001 |
| 1 | −0.397 (0.111) | ||
| 2 | −0.186 (0.112) | ||
| 3 or 4 | 1 [Reference] | ||
| Satellite (n = 115) | |||
| Invasive device percentage | |||
| None | −0.153 (0.105) | .15 | |
| Any | 1 [Reference] | ||
| Suctioning lapses | |||
| 0 | −0.347 (0.127) | 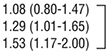 |
.03 |
| 1 | −0.172 (0.121) | ||
| 2, 3, or 4 | 1 [Reference] | ||
| Other academic (n = 92) | |||
| Invasive device percentage | |||
| None | −0.363 (0.181) | 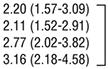 |
.10 |
| >0 to 35 | −0.405 (0.184) | ||
| >35 to 60 | −0.129 (0.186) | ||
| >60 | 1 [Reference] | ||
| Suctioning lapses | |||
| 0 | −0.353 (0.192) | 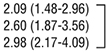 |
.19 |
| 1 | −0.144 (0.163) | ||
| 2, 3, or 4 | 1 [Reference] |
a
Exponential of the estimated marginal means (least squares means).
All models include the same covariates listed in Table 3.