Summary
Background: Type 1 diabetes requires frequent testing and monitoring of blood glucose levels in order to determine appropriate type and dosage of insulin administration. This can lead to thousands of individual measurements over the course of a lifetime of a single individual, of which very few are retained as part of a permanent record. The third author, aged 9, and his family have maintained several years of written records since his diagnosis with Type 1 diabetes at age 20 months, and have also recently begun to obtain automated records from a continuous glucose monitor.
Objectives: This paper compares regularities identified within aggregated manually-collected and automatically-collected blood glucose data visualizations by the family involved in monitoring the third author’s diabetes.
Methods: 7,437 handwritten entries of the third author’s blood sugar readings were obtained from a personal archive, digitized, and visualized in Tableau data visualization software. 6,420 automatically collected entries from a Dexcom G4 Platinum continuous glucose monitor were obtained and visualized in Dexcom’s Clarity data visualization report tool. The family was interviewed three times about diabetes data management and their impressions of data as presented in data visualizations. Interviews were audiorecorded or recorded with handwritten notes.
Results: The aggregated visualization of manually-collected data revealed consistent habitual times of day when blood sugar measurements were obtained. The family was not fully aware that their existing life routines and the third author’s entry into formal schooling had created critical blind spots in their data that were often unmeasured. This was realized upon aggregate visualization of CGM data, but the discovery and use of these visualizations were not realized until a new healthcare provider required the family to find and use them. The lack of use of CGM aggregate visualization was reportedly because the default data displays seemed to provide already abundant information for in-the-moment decision making for diabetes management.
Conclusions: Existing family routines and school schedules can shape if and when blood glucose data are obtained for T1D youth. These routines may inadvertently introduce blind spots in data, even when it is collected and recorded systematically. Although CGM data may be superior in its overall density of data collection, families do not necessarily discover nor use the full range of useful data visualization features. To support greater awareness of youth blood sugar levels, families that manually obtain youth glucose data should be advised to avoid inadvertently creating data blind spots due to existing schedules and routines. For families using CGM technology, designers and healthcare providers should consider implementing better cues and prompts that will encourage families to discover and utilize aggregate data visualization capabilities.
Keywords: Diabetes mellitus, juvenile-onset, data collection methods, informatics, personal health, quantified self, N-of-1
1. Introduction
Type 1 diabetes (T1D) is an incurable autoimmune disease that destroys the pancreas’s ability to naturally produce insulin, a hormone necessary for the absorption and storage of glucose. Failure to adequately monitor and manage blood glucose and insulin levels can lead to major vascular complications and organ damage from hyperglycemia [ 1 ] on the one hand and seizures, loss of consciousness, and death from hypoglycemia on the other [ 2 ]. In the United States, over a million adults live with T1D, and recent estimates are that over 200,000 youth (individuals under the age of 20) live with it as well [ 3 ]. While the United States Food and Drug Administration has recently approved an “artificial pancreas” device that will automatically manage blood sugar and release insulin into the bloodstream of a person with diabetes [ 4 ], its relative newness, cost, and the requirement that patients be at least 14 years old limit its accessibility to a substantial portion of the T1D population. An alternative that some diabetics have pursued is the creation of their own insulin management system using resources such as OpenAPS (Open Artificial Pancreas System, openaps.org). To date, users of OpenAPS have self-reported improved glycohemoglobin levels and increases in the amount of time that they were in a desired blood-sugar range. These same users observed, however, that the amount of technical know-how and efforts needed to create and maintain their self-developed artificial pancreas system are likely substantial obstacles that will limit broader adoption [ 5 ].
As such, diabetes management for most individuals with T1D involves frequent manual blood tests to measure the amount of sugar in one’s blood coupled with the manual administration of insulin multiple times during the day. In some cases, devices such as insulin pumps or continuous glucose monitors (CGM) may be used. Such devices typically obtain and store several days’ worth of specific data about how much insulin was administered and the blood sugar level readings for a patient over certain time intervals. Regardless of whether readings and administrations are done manually with a glucometer or with a pump or CGM, there are many measures being obtained by a person with diabetes even during a single day. What happens to those measures depends on the individual collecting the information and the technological infrastructure that they use, with some data being stored briefly mentally and others on proprietary cloud systems.
This current paper is a case study showing the comparative realizations that were made by a T1D-affected family upon examination of aggregated blood sugar information obtained using two data collection methods. One method was manual testing involving regular finger pricking and use of a separate glucometer accompanied by systematic handwritten logging. The other involved use of a CGM device. The diabetic individual whose data are examined and shared in this report is the third author (Chris), who explicitly asked (and with consent of his parents, as he was 9 years old at the time of this writing) that his identity be disclosed.
2. Objectives
The primary objective of this report is to illustrate what regularities are detected in aggregate visualizations of different blood glucose data collection methods of end users. In this case, the end users are the child with diabetes and his parents. One data collection method involved manual data collection and recording over the course of three and a half years, and the other involved data collected by a CGM. With this family, manual data collection turned out to exhibit blind spots due to daily family routines and transition to formal schooling that were only fully realized when data were aggregated. On the other hand, automated data collection created more data but tended to invite only examinations of data from preceding hours but not aggregate analysis for recurring daily patterns.
3. Methods
The quantitative data for this report were obtained by the second and third author and other family members prior to any plans for a research study. As such, this is a post hoc analysis of existing data. Since those who collected data are co-authors and written records exist as a paper trail, we are able to describe the data collection process with some accuracy.
The diabetic individual, Chris, had been diagnosed at approximately 20 months of age. His parents (including his father, the second author), began to prepare journals of Chris’s blood sugar data from the time of his diagnosis (August, 2010). The written log initially included records of how much of which insulin type was administered and when along with a detailed specification of what foods were eaten and the equivalent number of carbohydrates that would lead to an increase in blood glucose. The log (see ► Figure 1 ) served as the sole record of Chris’s blood sugar information in the family, and served as a boundary object [ 6 ] around which Chris, his parents, and ultimately health care practitioners, would discuss recent trends observed over past days and make necessary adjustments. The records that were manually recorded by Chris’s family were considered to be quite thorough relative to many other patient families and were important resources for both the parents and health care providers to examine when planning meals, activities, and insulin dosage.
Figure 1.
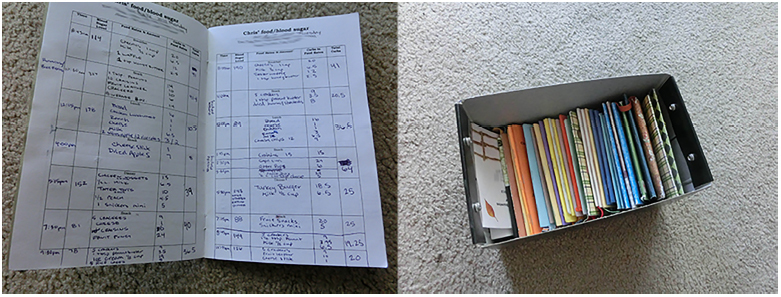
Journals recording blood glucose levels prepared by the third author and his family.
The journals changed in structure and content over time as carbohydrate and serving size information was internalized by family members, and they stopped logging that information. Eventually, only blood sugar levels and times of day were recorded. As part of another study related to educational and learning activities that take place by way of self-quantification in and out of the classroom [ 7 – 9 ], these journals were introduced to the first author. With the consent of Chris and his parents, the glucose measurements were digitized by the first author and research assistants. One month of data (March, 2013) was missing. In total, there were 7,437 entries from all the journals from August 2010 to February 2014. Details about the numbers of readings are provided in ► Table 1 .
Table 1.
Number of digitized handwritten glucose data measurements per year.
| Year | 2010 | 2011 | 2012 | 2013 | 2014 |
|---|---|---|---|---|---|
| Total Glucose Entries | 617 | 2595 | 2184 | 1899 | 142 |
| Time Period | 4 months | 12 months | 12 months | 11 months | 1 month and 5 days |
| Estimated number of readings per day | 5.14 | 7.21 | 6.07 | 5.75 | 4.06 |
Family circumstances changed in February, 2014 that made continued handwritten journaling difficult (February, 2014). Blood sugar readings were still obtained but not retained in a permanent record. In summer of 2014, Chris’s parents were able to purchase a CGM device and switched to it as the primary source and repository of blood glucose information. None of the CGM data were collected with the intention of performing a pre-planned self-experiment or to be used for third party analysis.
The CGM data were obtained through a Dexcom G4 Platinum (► Figure 2 ), which was configured to obtain a blood glucose reading every five minutes. The Dexcom unit was linked to Chris’s parents’ smart-phones so that they could be alerted to extraordinary deviations from desired blood sugar ranges (typically between 80 and 180 mg/dL). Because several dozen data points were accessible to Chris and his parents on an ongoing basis, these blood sugar data were not manually recorded by any individual. The information available when they were checking immediate blood sugar levels and the previous few hours was deemed adequate for routine in-the-moment decision making on their part with respect to deciding on Chris’s insulin dosage.
Figure 2.
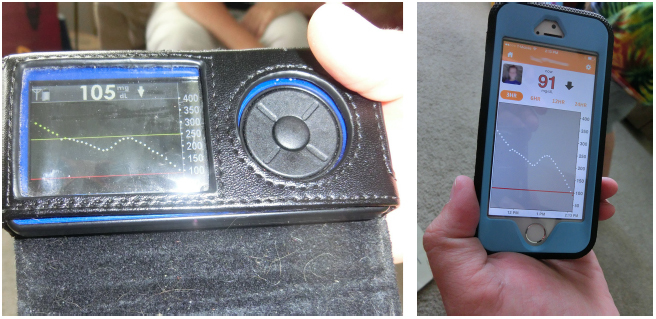
The Dexcom G4 Platinum continuous glucose monitoring device used by the third author and the mobile app and data display most frequently used by the third author’s parents in monitoring his glucose levels.
Due to some misunderstandings about how and for how long data were stored by the device, the readings from the Dexcom were not downloaded to be viewed or retained separately by the family until October of 2016, when the family switched endocrinologists (due to retirement of their longstanding provider) and were explicitly requested by the new attending endocrinologist to export the Dexcom data and bring specific reports to their first consultation. For the purposes of this paper, 14 days of CGM data are considered. That is the equivalent of 6,720 blood sugar data points. This number of days is considered for two reasons. One is that after preparing and reviewing an aggregate visualization of these fourteen days, Chris’s family noticed clear evidence of a regularity that they wanted to change for Chris’s benefit. Thus, those 14 days were prior to any intervention that was meant to mitigate the detected regularity. Secondly, this number of data points is comparable to the number of data points obtained in the manual record, albeit over a different time scale and density. By comparing roughly equal numbers of manually and CGM collected data points, we feel that the density of sampling and the inferences made from large numbers of visualized data points becomes foregrounded in our analysis rather than the absolute number of measurements.
In addition to the aforementioned numerical data, the first author met with Chris and his family on three occasions for 1–2 hours at a time to conduct open interviews with them about their data collection and experience with tracking and managing Chris’s blood sugar. Two interviews were audiorecorded at Chris’s home. One interview was recorded with handwritten notes as it took place in a public venue. These interviews form the basis of determining the family’s response and impressions of the data visualized from these two tracking methods. These were also supplemented with some additional qualitative records such as email correspondence between the parents and the first author. The overarching study and the interview procedures described had been approved by an institutional review board, and all necessary consent and assents were obtained in writing.
4. Results
4.1 Observed Features of Manually Collected Data Visualized
A plot prepared in Tableau of all manually obtained glucose readings over time of day across all days in the journals appears in ► Figure 3 . A secondary set of plots for years 2010–2013 (2014 was excluded because it was far fewer data points) showing the number of readings during each fifteen minute time interval (dots) and the computed average blood sugar level given all records during the associated 15 minute time interval in the associated year (line) is provided in ► Figure 4 .
Figure 3.
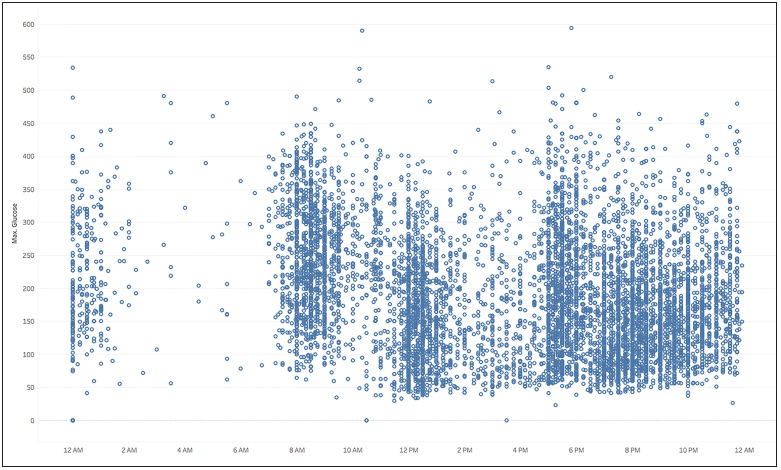
Aggregated plot of all manual measurements of blood glucose according to time of day and the blood glucose level.
Figure 4.
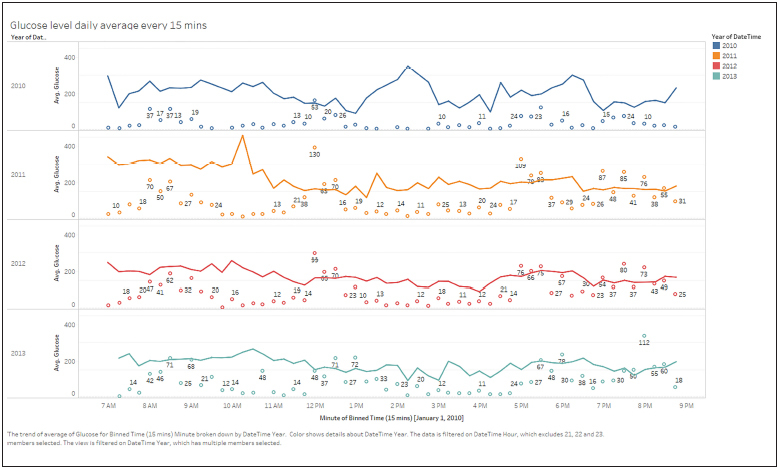
Multiyear plot of manually collected data from 2010–2013 showing numbers of measurements taken during 15-minute intervals (dots) and the average blood glucose levels from the corresponding readings (line).
From the audio and video records of the family’s examination of all aggregated manually obtain data, it was clear to Chris’s family that breakfast, lunch, and dinner were all heavily sampled times. This was reflected by the dark bars in the times roughly corresponding to 8:00 AM, 12:00 PM, and 7:00 PM. The evenings after 7:00 PM and up to roughly 11:00PM, when both parents were home, had more samples obtained than other four-hour time blocks including the time between breakfast and lunch and the time between lunch and dinner. They recognized that this was because of post-dinner snacking and the family was conscientious about monitoring blood sugar immediately before and after eating and in preparation of sleep. Chris’s morning readings obtained around breakfast time tended to have higher blood glucose levels than later ones, which they retroactively attributed to having just woken up and having generally more physically active afternoons with recreational activities such as preschool soccer programs.
There were not as many, but still several, readings in the middle of the night between midnight and 7:00 AM. As Chris’s parents described, if there were unusual readings prior to bedtime or if they had an intuitive hunch that it was possible for his blood sugar to be too low, they would do a prick test themselves in the middle of the night. Chris’s parents believe that there may have been more tests than reflected in ► Figure 2 and Figure 3 , but since it was the middle of the night, they recalled that they would overlook recording the middle of the night blood sugar readings especially if they were within what they considered to be an acceptable range.
Based on their examination of ► Figure 3 , Chris’s family did not feel there were any clear glucose level trends that could be ascertained. Since the data were separated by years and by times during the day, they were aware that outlier sensitivity could make some days’ readings appear high. Thus, it was not obvious there was a regularity in blood sugar levels. However, they did notice that in 2013 there were two times in the plot when their appeared to be a substantial increase in the number of blood sugar readings relative to other years. One of those times was about 10:30 AM, which in 2013 had 48 readings. In other years it had at most just a few. The other increase was at 8:00 PM which had 112 readings whereas in previous years there would usually be between 70–80 readings.
Upon reflection, Chris’s family realized that 2013 was the year that Chris began Kindergarten. For over three months, his daily schedule became structured around the school schedule, and 10:30 AM corresponded to the time just before his school’s morning recess. That was a consistent set time for a blood sugar reading at school. The 8:00 PM readings were attributable to a strict bedtime that was followed because of needing to wake up at a certain time for Kindergarten. Chris was the oldest child in the family and thus the first to have their home schedule affected by a public school schedule.
4.2 Observations from CGM Collected Data Visualized
With the Dexcom CGM data, the family reported relying most often on the numerical display on the CGM device and the ongoing reports from the Dexcom mobile device app (► Figure 2 ). As parents of multiple children and one parent working outside of the home full-time and pursuing graduate studies part time, the just-in-time access to immediate information was considered the most pressing and useful. Chris’s family had access to the Dexcom Clarity software, which produced data visualizations like the one shown in ► Figure 5 and Figure 6 . However, these were unused until they were switched to a new endicronologist who asked specifically for certain reports from the Clarity software.
Figure 5.

Visualization of two weeks of the third author’s automatically obtained blood sugar data produced by Dexcom Clarity tool.
Figure 6.
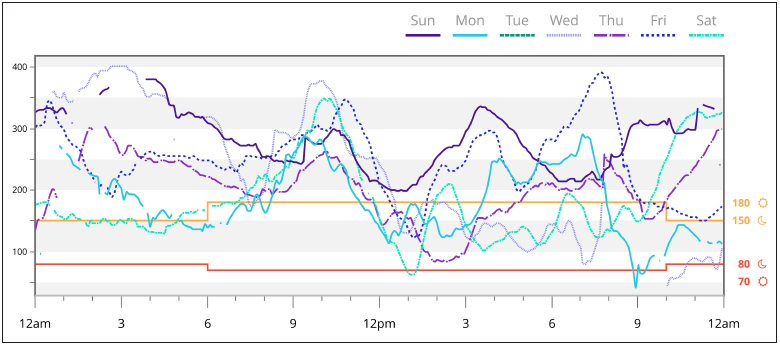
Visualization of the third author’s blood sugar levels each day of the week prepared by the Dexcom Clarity tool.
When the aggregated two weeks of Dexcom blood sugar data were examined as prepared in the Clarity software, the family noticed two clear, consistent, and surprising regularities (► Figure 5 ). One was that there was a steady increase in blood sugar levels in the morning between breakfast and lunch. As the previous manual sampling did not heavily sample during that time period, this regularity was not previously detected. This was consistent with another visualization of daily data provided by the Clarity visualization tool (► Figure 6 ). Together, this morning increase which they believe had been present for quite some time since they did not perceive major noteworthy changes to Chris’s daily insulin, dietary, or physical activity routines between when they had stopped maintaining paper journals and when they began to use the CGM. This led to an immediate change in when insulin would be administered in the morning with the hope of making that blood sugar increase go away.
The other regularity that was noted by Chris’s family was that the nighttime glucose levels were relatively high compared to awake hours. Chris’s parents retroactively attributed this to a cautious stance of theirs in which they tended to prefer he run high rather than low at night, as falling into a coma and already being asleep when that happens is a major concern for people with diabetes. Again, night time was not heavily sampled or recorded by the manual method. These relatively high blood sugar levels were not a regularity that the family had monitored, and they have since been re-evaluating how to help Chris manage his blood sugar at night.
5. Discussion
Through this juxtaposition of comparable numbers of blood sugar measurements, we observe that different features of youth diabetic blood sugar measurements that were detected and interpreted differently by the family. First, in the aggregated view of the manual data recordings, periods of frequent and regular sampling were revealed. Sampling was driven largely by eating, formal school schedules, and both parents being in immediate proximity to Chris. This sampling approach inadvertently created data blind spots for the family. The continuous glucose monitoring visualizations revealed that some of these blind spots were consequential. There were two periods of time (early morning prior to awakening and the hours between breakfast and lunch) that were previously undersampled through manual approaches, and those times showed higher blood sugar levels than what Chris or his parents desired or expected. This led to a change in treatment regimen, discussed generally with their endocrinologist and refined through daily family practice, that was informed by this new visualization.
However, that new CGM visualization was only obtained and reflectively examined when the family was called upon by a new doctor to provide a particular report using the Clarity tool. What was much more common and more accessible for the moment-to-moment decision making by individual members was independent examination of the most recent numerical readouts from Chris’s CGM and mobile apps that only showed a partial window of the typical day. In retrospect, the family reported that the ease and frequency of immediate and abundant data access seemingly contributed to a sense that they knew more about what was happening with Chris’s blood sugar already at any given moment. Until they switched endocrinologists, they were not otherwise being cued to produce aggregate reviews of his data, and operated off of partial (but to their view, seemingly abundant) blood sugar information. Thus, while they had the ability to examine blind spots in detail, there was little prompting that necessitated such examinations amidst the hustle and bustle of daily family life. As the opportunity for new technologies and more data obtained through a range of biosensors beyond CGM become increasingly available to aid in the management of chronic conditions like T1D [ 10 ], such considerations for how such data will be routinely reviewed and used by families remain important for improving youth health management.
6. Conclusions
In conclusion, there are two major lessons embedded in this case study. One is that day-to-day routines and childhood school day schedules can affect how data are obtained for a T1D youth. This became apparent in this case with a family that diligently maintained a multiyear written record of blood sugar test results. The aggregation of these years of records revealed blind spots within a systematically collected personal data archive. The other lesson is that while new digital tools might have embedded features and accessories that allow families to inspect and review aggregated blood sugar data, there is no assurance that such features will be organically used. Studies of user-technology interaction consistently demonstrate that just because functionality exists, users may not know about or access it [ 11 ] and the addition of just a few extra cognitive actions – in this case, exporting data, switching to different view settings, and recognizing that there were times that were previously overlooked – can implicitly dissuade pursuit of new routines [ 12 ]. Considering these features went unused by a highly motivated family who took the time and effort to systematically record years of bloodsugar data and otherwise educate themselves and others about T1D, this suggests that those interested in medical information and personal information management should consider when and how data collection and reflection can be better motivated so that these blind spots are better examined in situ.
Automated tools and resources such as artificial pancreas systems or CGM technology may be attractive because they have the potential of obtaining and storing large amounts of frequently obtained data. However, better prompting or cueing for examination of data visualization features should be encouraged for the collected data to be made maximally informative to families and their healthcare providers. This could take the form of automatic reports being generated and appearing as alerts in their applications or in creating expectations of standard data visualization forms that are to be shared between patients and healthcare providers. Designers and tool developers should also be aware that users can mistakenly take large amounts of recent data to be alone sufficient when views of data at multiple time scales would be more informative for better health management.
Acknowledgment
The authors acknowledge the assistance of Joel Drake, Liam Fischback, and Kourtney Schut in assisting with data digitization and the Thurston family for sharing their data.
Funding Statement
Funding: This work was partly supported by a grant from the National Science Foundation, DRL-1054280. The opinions expressed herein are those of the authors and do not necessarily reflect those of the National Science Foundation.
References
- 1.Giugliano D, Ceriello A, Paolisso G. Oxidative stress and diabetic vascular complications. Diabetes Care. 1996;19 03:257–267. doi: 10.2337/diacare.19.3.257. [DOI] [PubMed] [Google Scholar]
- 2.Cryer PE, Davis SN, Shamoon H. Hypoglycemia in Diabetes. Diabetes Care. 2003;26 06:1902–1912. doi: 10.2337/diacare.26.6.1902. [DOI] [PubMed] [Google Scholar]
- 3.Imperatore G, Boyle JP, Thompson TJ, Case D, Dabelea D, Hamman RF. Projections of Type 1 and Type 2 Diabetes Burden in the US Population Aged < 20 Years Through 2050 Dynamic Modeling of Incidence, Mortality, and Population Growth. Diabetes Care. 2012;35 12:2515–2520. doi: 10.2337/dc12-0669. [DOI] [PMC free article] [PubMed] [Google Scholar]
- 4.Voelker R. “Artificial pancreas” is approved. JAMA. 2016;316 19:1957. doi: 10.1001/jama.2016.16344. [DOI] [PubMed] [Google Scholar]
- 5.#OpenAPS Community. . Lewis D, Leibrand S. Real-World Use of Open Source Artificial Pancreas Systems. Journal of Diabetes Science and Technology. 2016;10 06:1411. doi: 10.1177/1932296816665635. [DOI] [PMC free article] [PubMed] [Google Scholar]
- 6.Star SL, Griesemer JR. Institutional Ecology, “Translations” and Boundary Objects: Amateurs and Professionals in Berkeley’s Museum of Vertebrate Zoology, 1907–39. Social Studies of Science. 1989;19 03:387–420. [Google Scholar]
- 7.Lee VR, Polman JL, Kyza EA, O’Neill DK, Tabak I, Penuel WR, Jurow AS, O’Connor K, Lee T, D’Amico L.What’s Happening in the Quantified Self Movement?In:Learning and Becoming in Practice: The International Conference of the Learning Sciences (ICLS) 2014. 2 Boulder, CO: ISLS; 20141032–1036. [Google Scholar]
- 8.Lee VR, Drake J.Digital physical activity data collection and use by endurance runners and distance cyclists Technology, Knowledge and Learning 2013181-239–63. [Google Scholar]
- 9.Lee VR, Drake JR, Thayne JL. Appropriating Quantified Self Technologies to Improve Elementary Statistical Teaching and Learning. IEEE Transactions on Learning Technologies. 2016;9 04:354–365. [Google Scholar]
- 10.Li X, Dunn J, Salins D, Zhou G, Zhou W, Schüssler-Fiorenza Rose SM. Digital Health: Tracking Physiomes and Activity Using Wearable Biosensors Reveals Useful Health-Related Information. PLOS Biology. 2017;15 01:e2001402.. doi: 10.1371/journal.pbio.2001402. [DOI] [PMC free article] [PubMed] [Google Scholar]
- 11.Norman DA. New York: Currency Doubleday;; 2002. The Design of Everyday Things. [Google Scholar]
- 12.Thaler RH, Sunstein CR. New Haven, CT: Yale University Press;; 2008. Nudge: Improving decisions about health, wealth, and happiness. [Google Scholar]


