Figure 4.

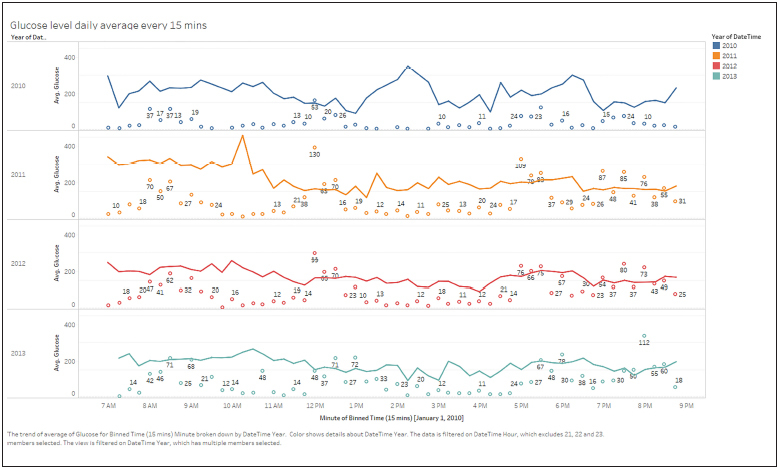
Multiyear plot of manually collected data from 2010–2013 showing numbers of measurements taken during 15-minute intervals (dots) and the average blood glucose levels from the corresponding readings (line).

Multiyear plot of manually collected data from 2010–2013 showing numbers of measurements taken during 15-minute intervals (dots) and the average blood glucose levels from the corresponding readings (line).