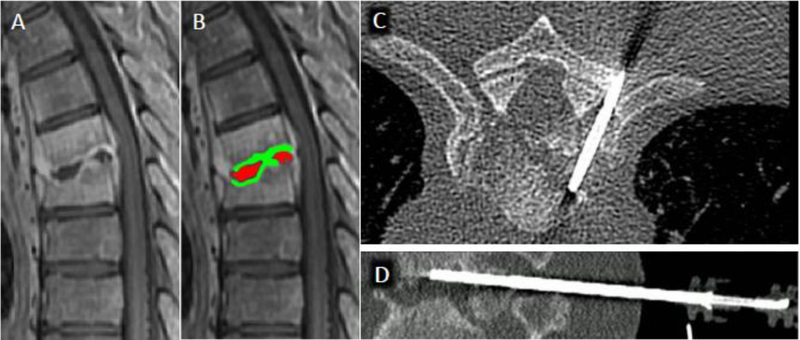
Figure 23.
CT-guided percutaneous biopsy for discitis-osteomyelitis (DOM). A) Sagittal T1 post contrast MR image centered at the mid-thoracic spine shows abnormal T6 and T7 vertebral body enhancement with endplate erosion and liquefaction of the T6-T7 disc space. B) Sampling of the non-enhancing purulent disc material (delineated in red) tends to yield sterile specimens, therefore inclusion of the adjacent enhancing vertebral endplate and subchondral bone (delineated in green) tends to produce higher yields. Axial (C) and sagittal (D) CT images from biopsy procedures shows positioning of the core biopsy needle to include both disc and superior endplate/subchondral bone.

