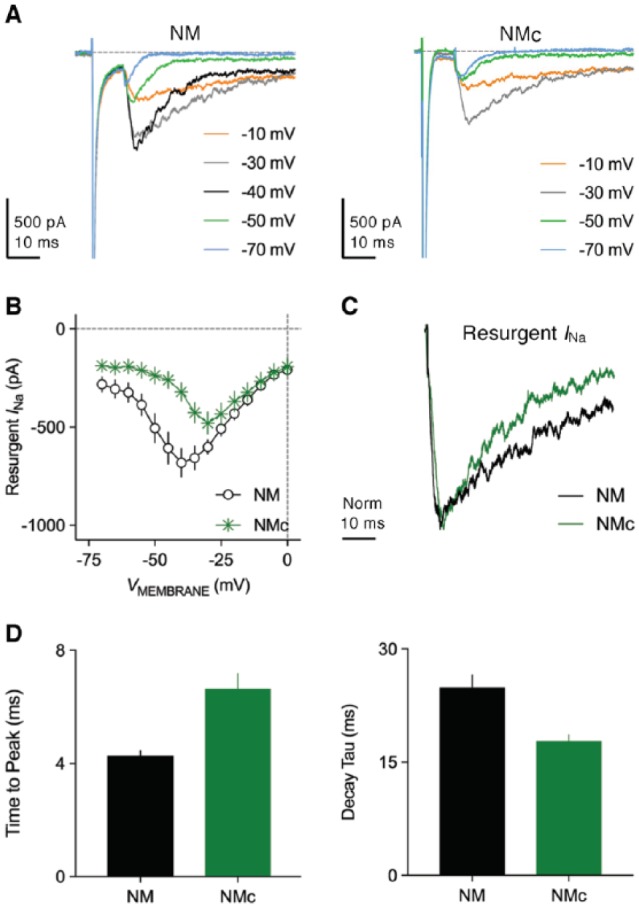
Figure 10.

Resurgent sodium current properties. (A) Representative current traces recorded from mid- to high-frequency NM and NMc neurons in response to membrane depolarization to +30 mV (duration = 10 ms) followed by repolarization at varying membrane voltages (indicated in different colors). (B) Population data showing the amplitude of resurgent sodium current as a function of repolarizing membrane voltage (VMEMBRANE) for the two neuronal groups. (C) Representative normalized resurgent sodium current traces recorded from mid- to high-frequency NM and NMc neurons. (D) Population data showing the differences in time to peak and decay tau (time constant) of resurgent sodium current between the two neuronal groups. NM indicates nucleus magnocellularis.
