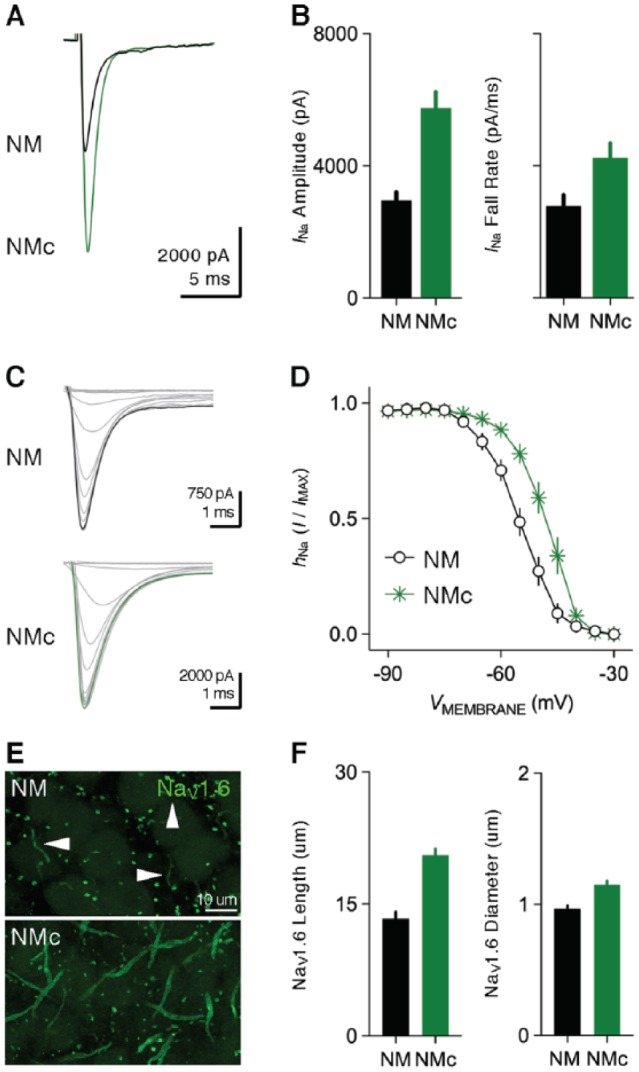
Figure 6.

Voltage-dependent sodium (NaV) current properties. (A) Representative transient NaV current traces recorded from mid- to high-frequency NM and NMc neurons in response to membrane depolarization at −30 mV. (B) Population data showing the differences in NaV current (INa) amplitude and fall rate at the membrane voltage of −30 mV between the two neuronal groups. Both bar graphs share the same scale in Y-axis. (C) Representative NaV current traces recorded from mid- to high-frequency NM and NMc neurons, in response to depolarization to −30 mV following pre-pulse holding voltages from −90 to −30 mV in a step of 10 mV. (D) Population data showing voltage dependence of NaV channel inactivation for the two neuronal groups. hNa was calculated as the NaV current recorded for each trial normalized to the maximum current across all trials and plotted as a function of the holding voltage. (E) High power images with z-projection showing the immunoreactivity of NaV1.6 subtype in mid- to high-frequency NM and NMc regions. Arrowheads point to NaV1.6-positive axon segments. (F) Population data showing the differences in length and diameter of NaV1.6-positive segments in mid- to high-frequency NM and NMc regions. Error bar = standard error. Data were adapted from Hong et al.42,43 NM indicates nucleus magnocellularis.
