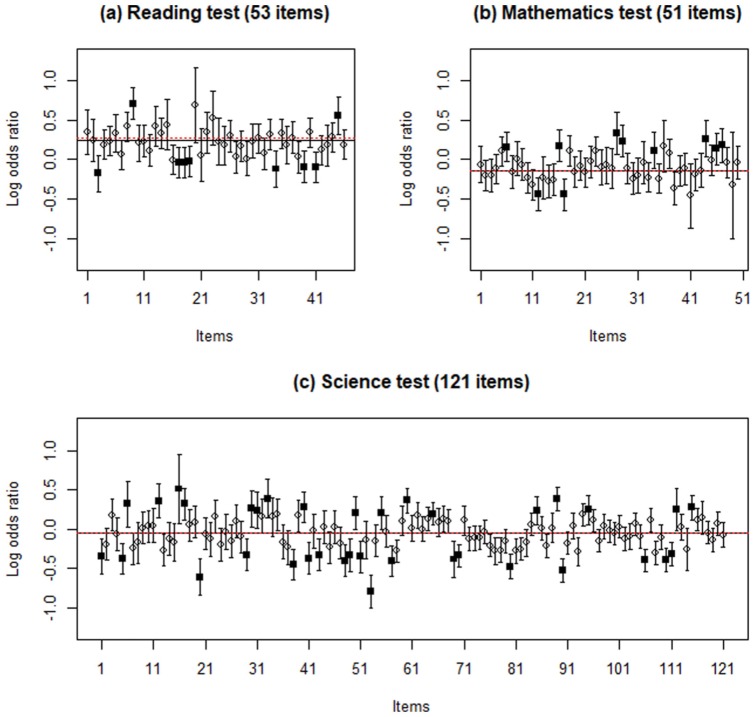
Figure 1.
Log odds ratios and 95% confidence intervals for three tests in the PISA 2015.
Note. Circles and squares refer to non-DIF and DIF items, respectively; solid and dotted lines are the medians and means across non-DIF items, respectively. PISA = Program for International Student Assessment; DIF = differential item functioning.

