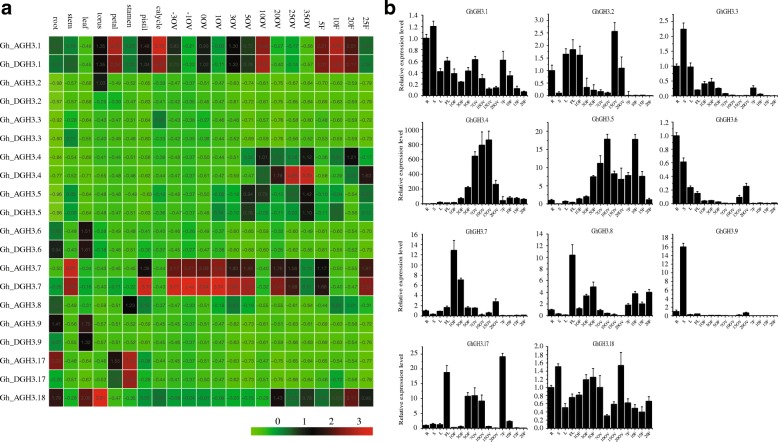
Fig. 5.
Expression profile of GhGH3s based on RNA-seq and qRT-PCR in various tissue/organs/stages. a Trends in GhGH3 gene expression based on publicly available RNA-seq data. Expression of individual genes are shown for 20 GhGH3s. Numbers on the x-axis indicate days post anthesis, with negative numbers implying days before anthesis. The prefix OV is for ovules and F for fiber. Green, black and red backgrounds represent low, intermediate and high expression levels, respectively. The original RPKM (reads per kilobase per million) values are normalized to 0–1 and shown in boxes. b Pattern of gene expression by qRT-PCR analysis. Expression of allele pairs or individual genes are shown. Values on the y-axis represent relative expression levels while the x-axis indicates days post anthesis. Materials from the field under normal conditions were tagged and sampled. The relative expression levels of GhGH3 genes were measured in roots (R), stems (S), leaves (L), flowers (FL), early stage developing ovules with attached fibers (1, 3, 5 DPA OF, ovules plus fibers), and different stages of detached ovules and fibers (7, 10, 15, 20 DPA O/F, ovules or fibers). GhHis 3 was used as an internal control to normalize the expression data. Error bars show standard deviation calculated from three replicates

