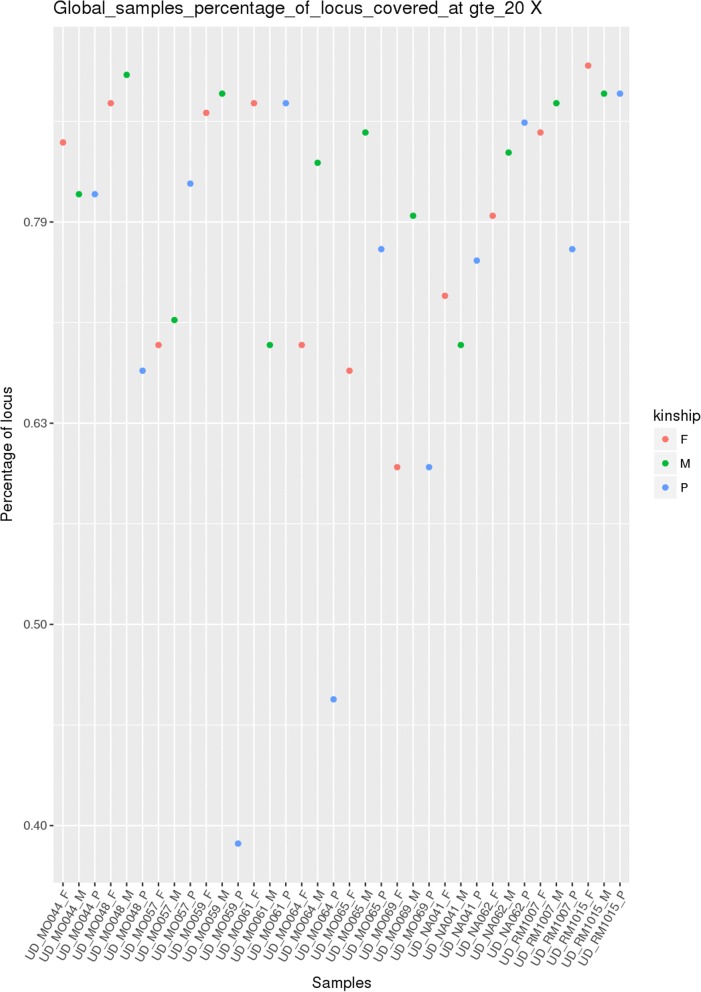
Fig. 5.
Example figure for global percentage of target coverage plot. This plot shows the percentage of the target covered by samples obtained with the same target file and can be used for sequencing run evaluation. This kind of plot is print by VarGenius at different levels of coverage (1X, 10X, 20X, 40X, 80X,100X). The figure shows the coverage of the target at 20X. Three different colors are used for kinship of the samples (probands, mothers and fathers)

