Fig. 1.

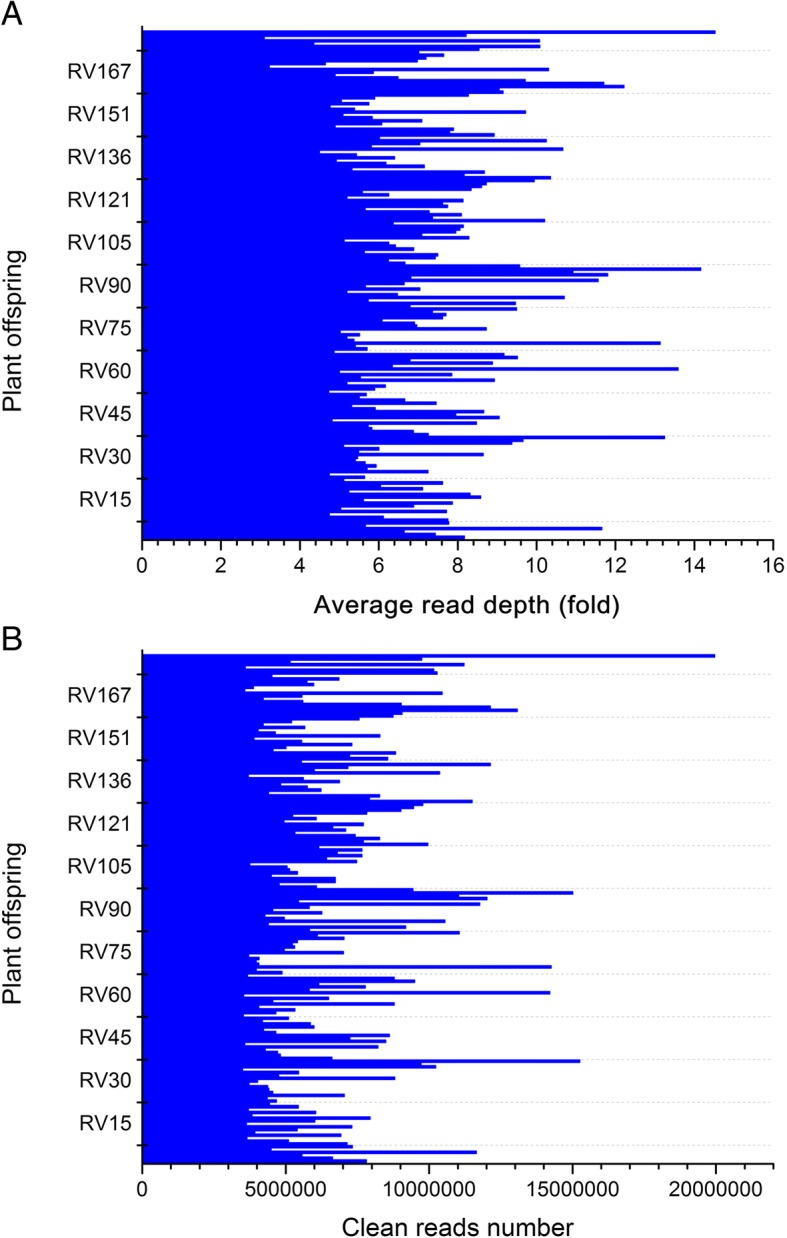
a, b Average read sequencing depth (fold) (a) and number of clean reads (b) expressed as genome equivalents of the 176 F1 individuals (shown in the X axis)

a, b Average read sequencing depth (fold) (a) and number of clean reads (b) expressed as genome equivalents of the 176 F1 individuals (shown in the X axis)