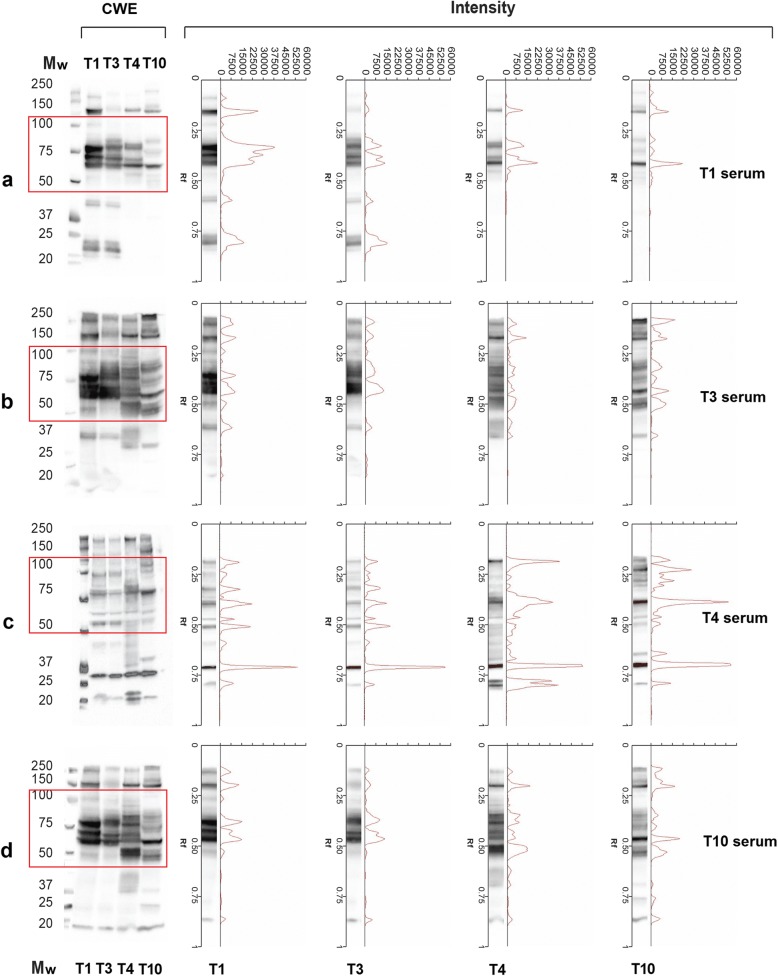
Fig. 2.
Western blot (Wb) patterns, signal intensities and relative migration (Rf) values of Trichinella spp. crude worm extracts (CWE) with serum samples from mice infected with Trichinella spiralis (Lane T1), T. britovi (Lane T3), T. pseudospiralis (Lane T4) and T. papuae (Lane T10). a T. spiralis (T1) infected mouse serum; b T. britovi (T3) infected mouse serum; c T. pseudospiralis (T4) infected mouse serum; d T. papuae (T10) infected mouse serum. Comparison of Wb patterns and intensities are on the left and on the right, respectively. Lane Mw: molecular weights in kDa. Red boxes refer to the highest differences detected in the Wb patterns

