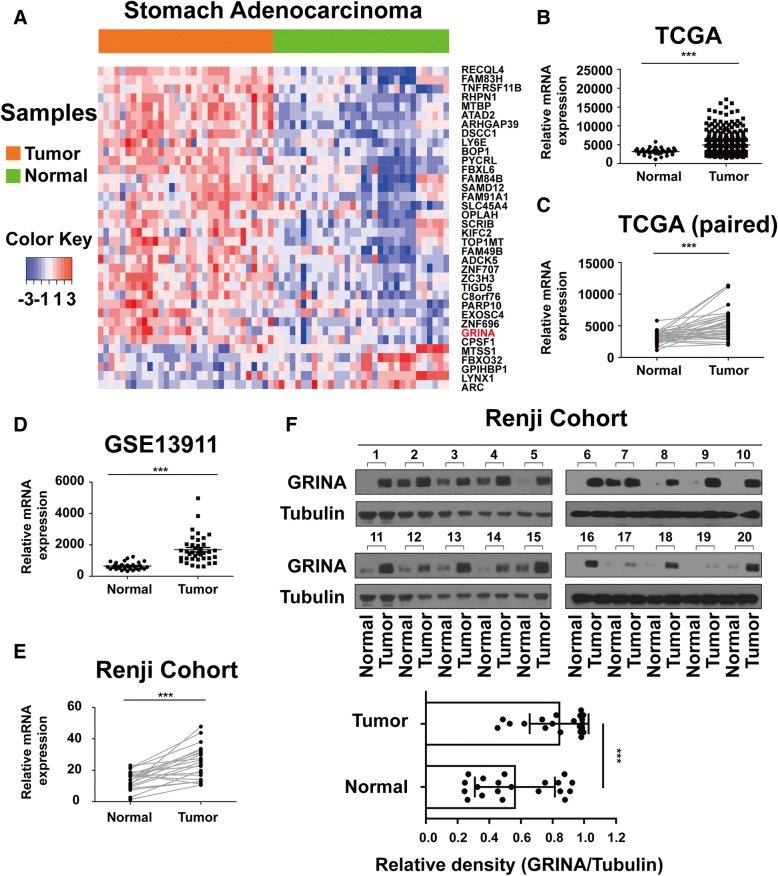
Fig. 1.
Elevated GRINA expression in gastric cancer. a Heatmap of 36 dysregulated genes on chromosome 8q24 (fold change > 1.5 or fold < − 1.5; q value < 0.001). Each column represents an individual sample and each row represents one gene. b Relative GRINA mRNA expression in 415 gastric cancer samples and 35 normal samples from TCGA database. c Relative GRINA mRNA expression in 32 gastric cancer samples and 32 matched normal samples from TCGA database. d Relative GRINA mRNA expression in 38 gastric cancer samples and 31 normal samples from GSE13911 database. e-f mRNA and protein levels of GRINA in 20 pairs of fresh gastric cancer samples were determined by real-time PCR and western blotting. T, tumor sample; N, normal sample. (N = 3). Values are mean ± s.d., ***P < 0.001 (Student’s t-test)

