Fig. 6.
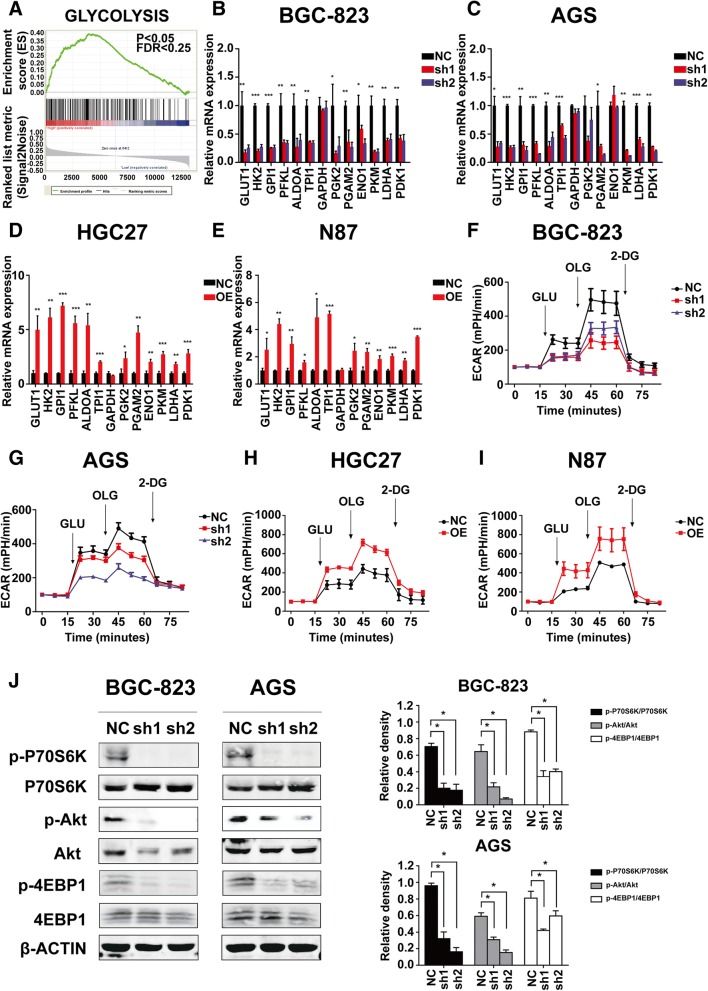
GRINA facilitated gastric cancer cell survival by modulating aerobic glycolysis. a GSEA plot based on the gene expression profiles of gastric cancer samples from TCGA database. b-c Relative mRNA levels of glycolysis-related genes in the control groups and the shRNA groups (N = 3). d-e Relative mRNA levels of glycolysis-related genes in the control groups and the GRINA-OE groups (N = 3). f-g Extracellular acid ratio (ECAR) upon knockdown of GRINA or not in BGC-823 and AGS cells. Glc, glucose; O, oligomycin; 2-DG, 2-deoxyglucose (N = 3). (H-I) ECAR upon overexpression of GRINA or not in HGC27 and N87 cells. Glc, glucose; O, oligomycin; 2-DG, 2-deoxyglucose (N = 3). j After GRINA expression was downregulated, total and phosphorylated Akt, P70S6K, 4EBP1 were measured by western blotting analysis (N = 3). Values are mean ± s.d., *P < 0.05, **P < 0.01, ***P < 0.001 (Student’s t-test)

