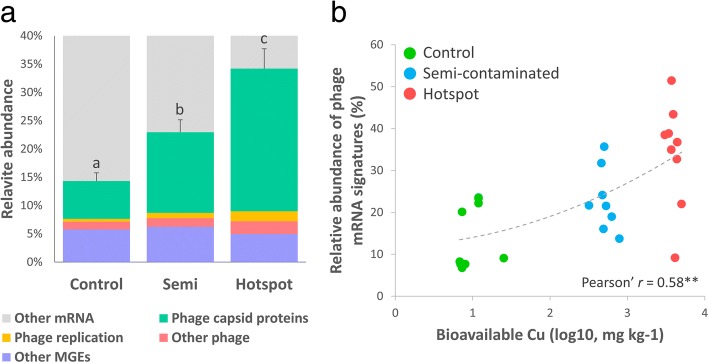
Fig. 3.
Panel a shows the relative abundance of functions within the “Mobile Genetic Elements” category (MGE) where phage mRNA signatures were detected among the metatranscriptomes of three plots (Control n = 9; Semi-contaminated n = 8; Hotspot n = 8). Statistical differences between time points in each plot were inferred with ANOVA (Tukey’s HSD post hoc test, p < 0.05). Letters are attributed in ascending order, “a” being the smallest average. Different letters indicate statistically significant differences (p < 0.05). Panel b shows the correlation between the relative abundance of phage mRNA signatures and bioavailable Cu in each samples from the three plots (Pearson’ r = 0.58, p = 1.2E−3)

