
Fig. 1.
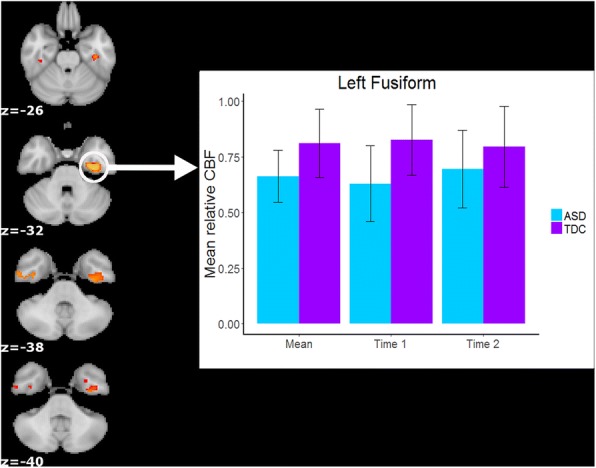
TDC > ASD regional cerebral blood flow (rCBF; p < 0.05 corrected with FSL’s threshold-free cluster enhancement algorithm within randomize). Coordinates are in MNI space and are rendered in radiological orientation (right side of image is the left hemisphere). The bar graph illustrates how the main effects of group were present in both individual scan sessions (i.e., no interaction effect with scan session) for the left fusiform gyrus cluster