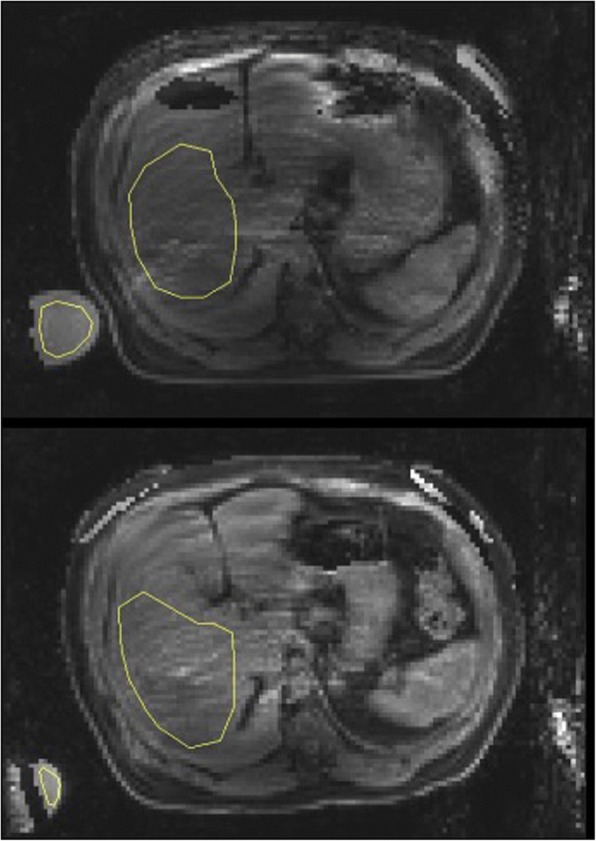
Fig. 1.

Water image from CSE-MRI reconstruction showing the Region of Interest (ROI) in the liver for which liver water content was computed. ROIs were drawn to avoid major vessels, and regions which contained water-fat swaps. A water phantom is shown in the lower left, which was used for normalization to obtain absolute. These two images were from Patient 14. Top: pre-dialysis (0.7) and bottom: post-dialysis (0.83)
