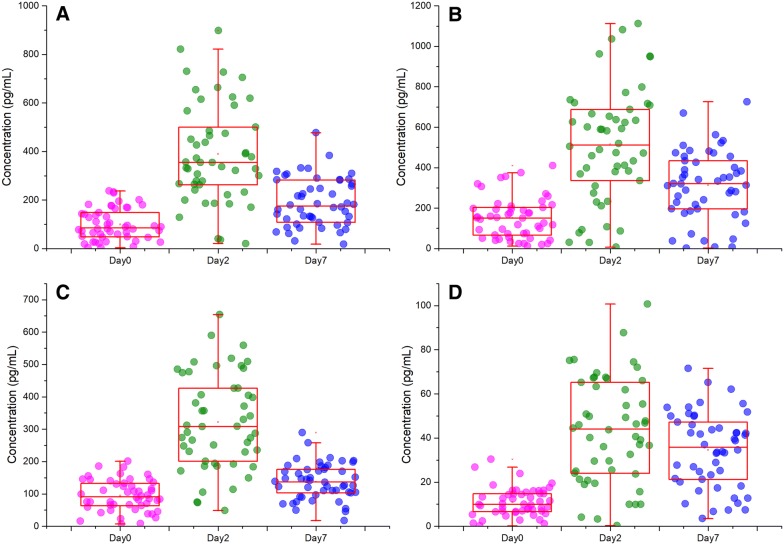
Figure 4.
Peripheral blood concentrations in Salmonella-challenged pigs. Serum protein levels were measured prior to challenge and at 2 and 7 dpi using ELISA. Results are presented as box plots plus scatter plots for each sample. Plots A–D show the results of TNF-α, IFN-γ, TGFB1, and TRP53 respectively.

