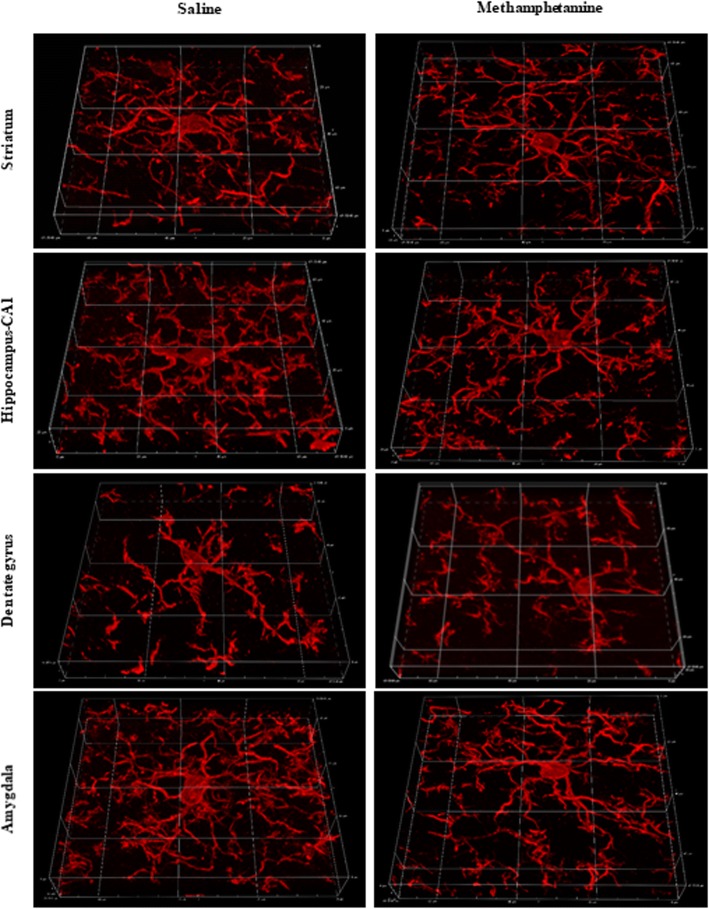
Fig. 1.
Immunohistochemical staining of Iba1 antigen for visualizing mouse microglial cells after METH administration. 3D reconstructions of 60× stacked images of microglia from striatum, CA1 and dentate gyrus of hippocampus, and from amygdala after 7 days of single, daily i.p. injections of either saline or METH (4 mg/kg). Note the absence of microglial hypertrophy (activation) after METH suggesting minimal neurotoxic damage in this particular injection paradigm. Graticule size, 20 μm

