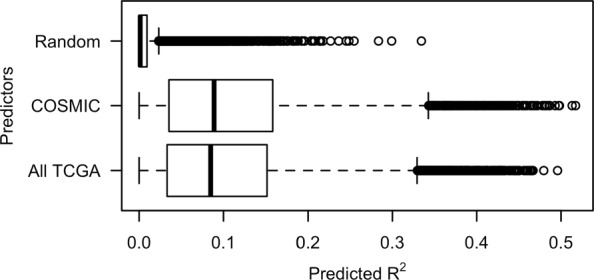
Fig. 3.

Distribution of values. Box plot illustrating the distribution of values from the analysis of TCGA pan cancer data using the MSigDB curated canonical pathways (C2.CP) collection. Values are shown for three different analyses: COSMIC: estimation of pathway regression models using somatic alteration data for COSMIC consensus cancer genes, All TCGA: estimation of models using somatic alteration data for all genes included in the TCGA datasets, and Random: estimation of models using randomized somatic alteration data for COSMIC consensus cancer genes
