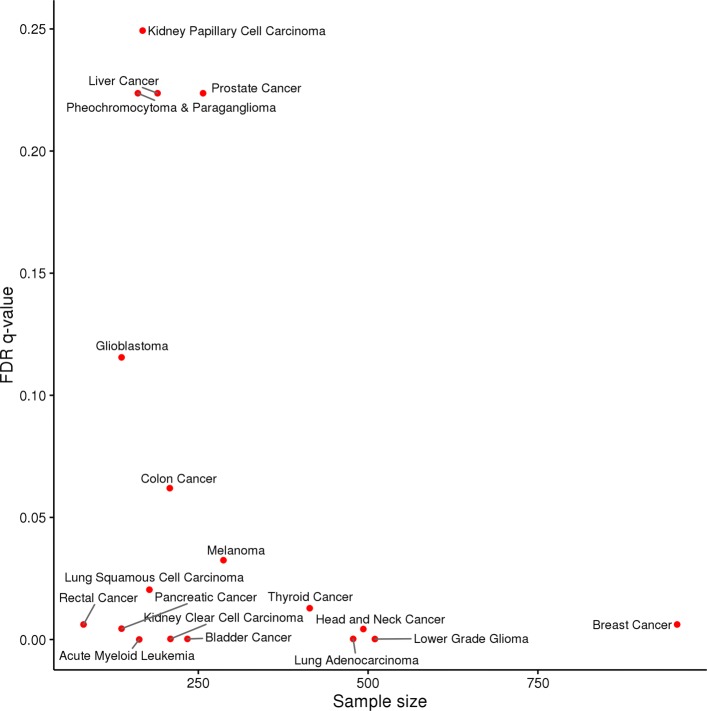
Fig. 5.
Enrichment of known cancer driver genes. The false discovery rate (FDR) q-values (as computed using the Benjamini and Hochberg (BH) [38] method) for the Wilcox rank sum tests of enrichment of known driver genes among the ranks of all predictors for the MSigDB C2.CP models using all TCGA genes. The q-value for each cancer type cohort is plotted relative to the cohort sample size. All but one cancer type has a q-value of < 0.1 with a general association between significance and sample size

