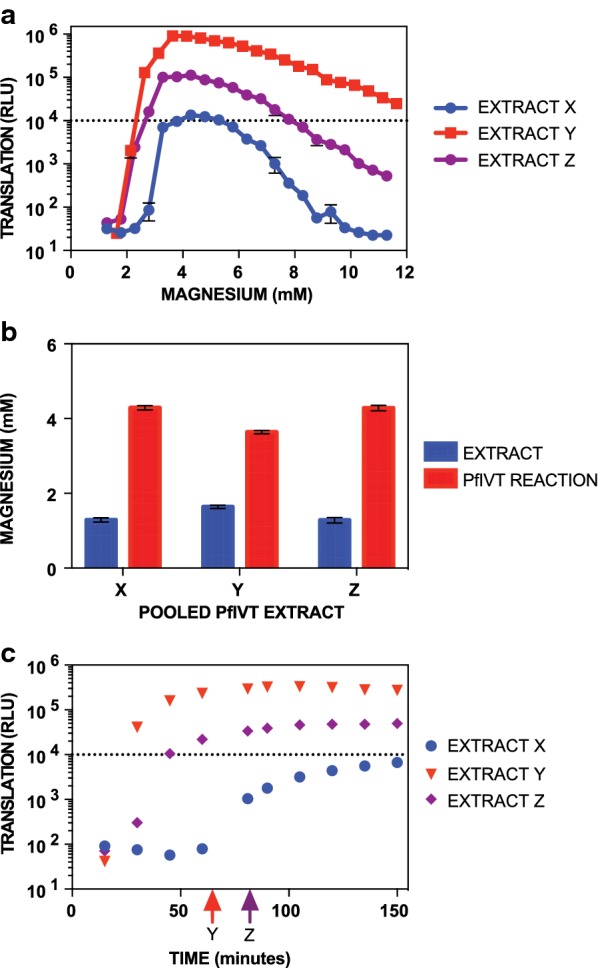
Fig. 1.

Optimization and quality control parameters of PfIVT extracts. a Translational activity of 3 representative extracts (X, Y, and Z) over a range of reaction magnesium concentrations. b Measured basal extract magnesium concentration (blue bars) and optimum translation reaction magnesium concentration (red bars) for each of 3 representative PfIVT extracts (X, Y, and Z). c Kinetic curves for translational activity of each of 3 representative PfIVT extracts (X, Y, and Z) at the optimum reaction magnesium concentration shown in part B. Arrows indicate the timepoint to use for inhibition assays in the extracts meeting the activity threshold, indicating ~ 75% of saturation signal. The dashed line at 104 relative luciferase units (RLU) represents the cutoff for acceptable translational activity for the assay. Extract X does not consistently meet the 104 RLU activity threshold and would not be used for PfIVT assays
