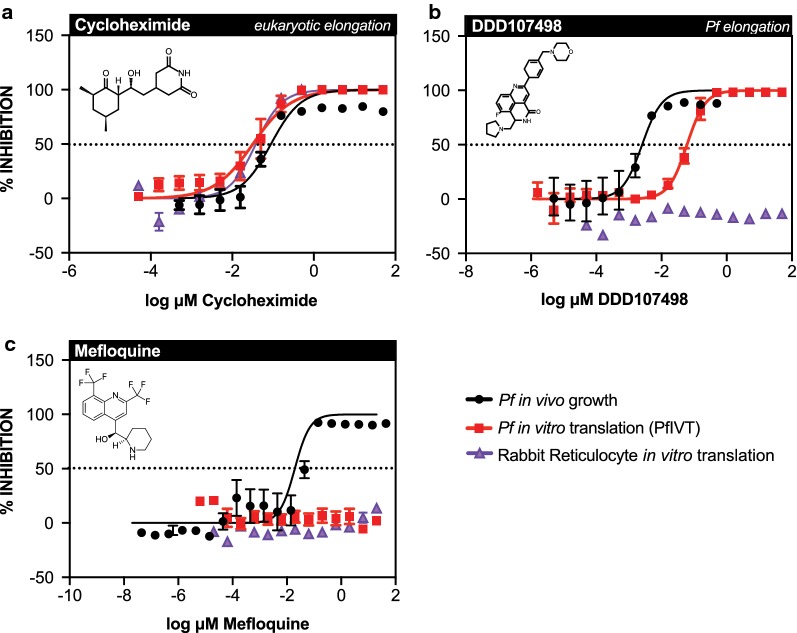
Fig. 5.
Dose-response curves of Pf growth, PfIVT, and RRIVT for mefloquine and controls. Dose-response curves comparing inhibition, calculated as % inhibition, of P. falciparum growth assay (black), P. falciparum in vitro translation assay (red), and commercially available rabbit reticulocyte in vitro translation assay (purple) for a cycloheximide, b DDD107498 (M5717), and c mefloquine. Name of compound, mechanism of action (where definitively known), and molecular structure are displayed at top of each graph

