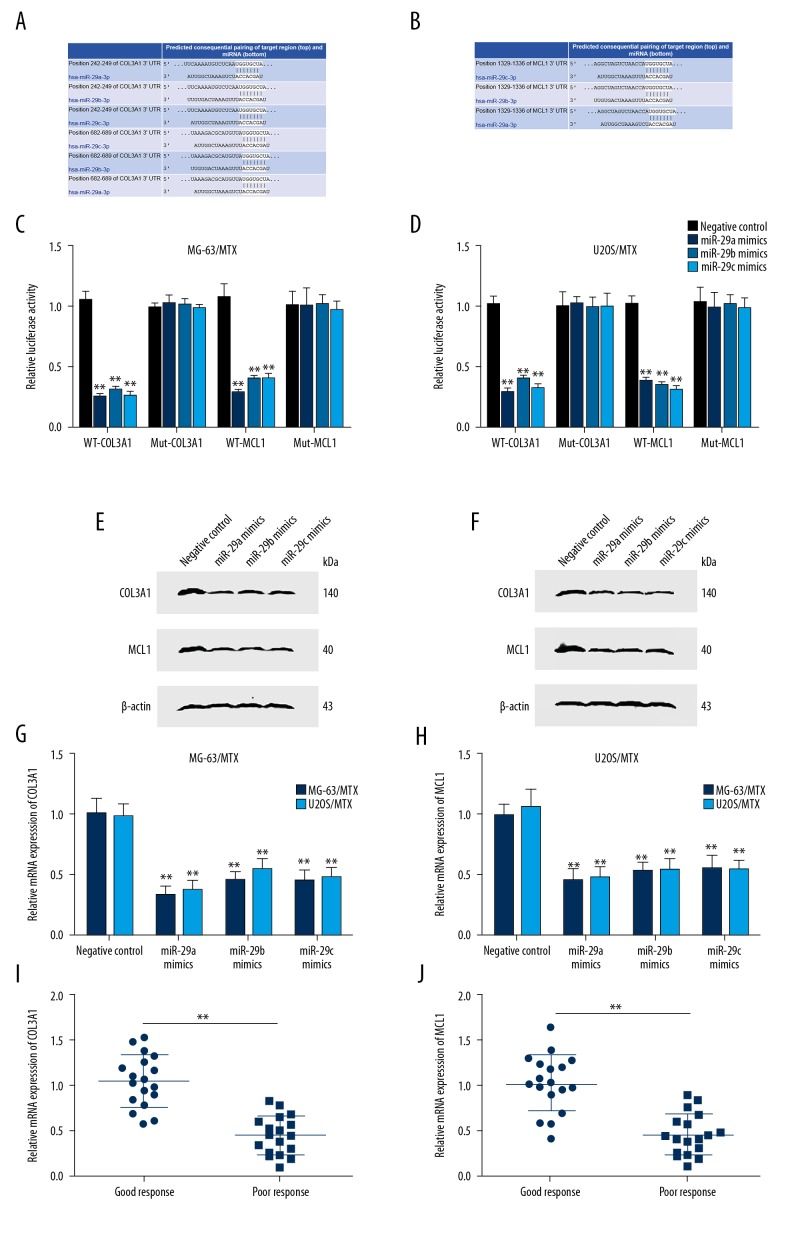
Figure 3.
miR-29 family directly targeted COL3A1 and MCL1. (A) Binding sites of the 3′UTR of COL3A1 for miR-29abc predicted by TargetScan. (B) Binding sites of the 3′UTR of MCL1 for miR-29abc predicted by TargetScan. (C) Luciferase reporter assay validated that miR-29abc directly targets the 3′UTR of COL3A1 and MCL1 in MG-63/MTX cells. (D) Luciferase reporter assay validated that miR-29abc directly targets the 3′UTR of COL3A1 and MCL1 in U2OS/MTX cells. (E) Overexpression of miR-29abc in MG-63/MTX cells reduced COL3A1 and MCL1 protein expression level determined by Western blot analysis compared with negative control. (F) Overexpression of miR-29abc in U2OS/MTX reduced COL3A1 and MCL1 protein expression level determined by Western blot analysis compared with negative control. (G) Transfection with miR-29abc mimics in MG-63/MTX and U2OS/MTX cells reduced COL3A1 mRNA expression level determined by qRT-PCR compared with negative control. (H) Transfection with miR-29abc mimics in MG-63/MTX and U2OS/MTX cells reduced MCL1 mRNA expression level determined by qRT-PCR compared with negative control. (I) Relative mRNA expression of COL3A1 in 18 poor-response osteosarcoma tissues (<90% tumor necrosis after chemotherapy) and 18 stage-matched good-response osteosarcoma tissues (≥90% tumor necrosis after chemotherapy) as analyzed by qRT-PCR. (J) Relative mRNA expression of MCL1 in 18 poor-response osteosarcoma tissues (<90% tumor necrosis after chemotherapy) and 18 stage-matched good-response osteosarcoma tissues (≥90% tumor necrosis after chemotherapy) as analyzed by qRT-PCR. ** P<0.01. (C, D, G, H) compared with negative control. (I, J) compared with good-response osteosarcoma tissues.

