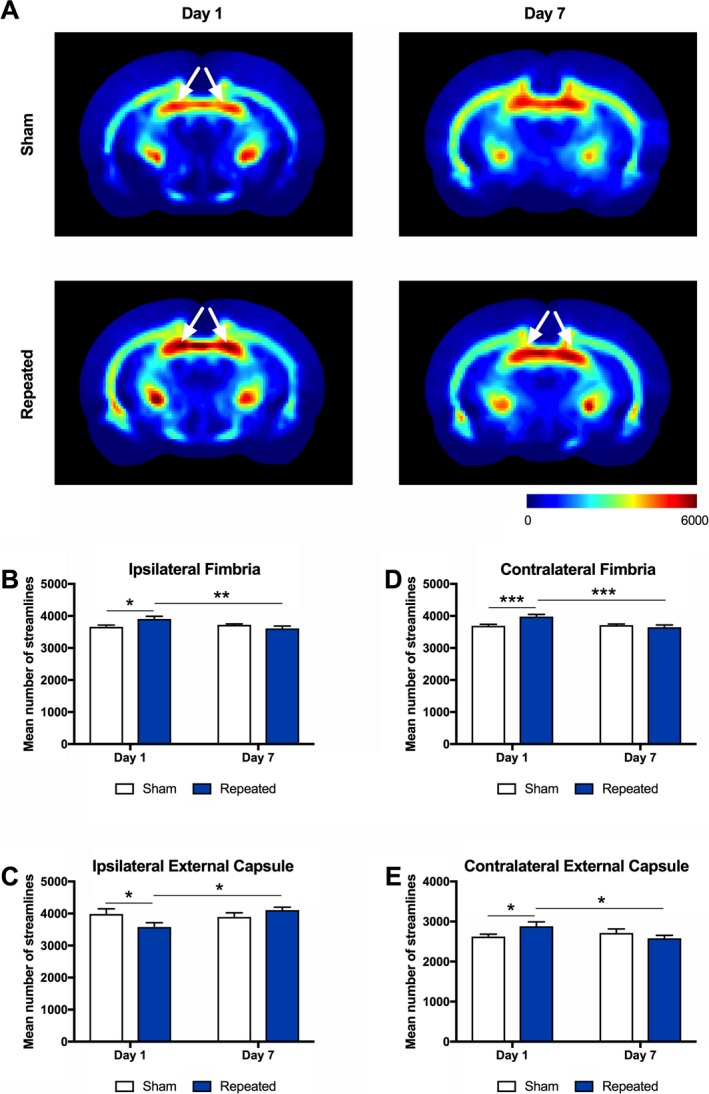
Figure 4.

Track density imaging (TDI) detects abnormalities after repeated mTBI. (A) Representative images of the mean number of streamlines (i.e., TDI) in sham (top row) and repeated mTBI (bottom row) rats at Day 1 and Day 7. Repeated mTBI rats displayed a significant increase in streamlines at Day 1 as compared to sham in the (B) ipsilateral middle fimbria and (D) contralateral middle fimbria (see white arrows), and the repeated mTBI values decreased from Day 1 to Day 7 postinjury. (C) In the ipsilateral posterior external capsule, streamlines were decreased in the repeated mTBI group compared to the sham at Day 1, and the repeated mTBI values increased from Day 1 to Day 7 postinjury (note that posterior representative images are not shown). (E) In the contralateral anterior external capsule, streamlines were increased in the repeated mTBI group compared to the sham at Day 1, and the repeated mTBI values decreased from Day 1 to Day 7 postinjury (note that anterior representative images are not shown). Mean ± SEM, *P < 0.05; **P < 0.01; ***P < 0.001. See Results for further details.
