
Figure 4. Mst1/2 orchestrate selective expression of IL-12 in CD8α+ DCs via crosstalk with non-canonical NF-κB signaling.
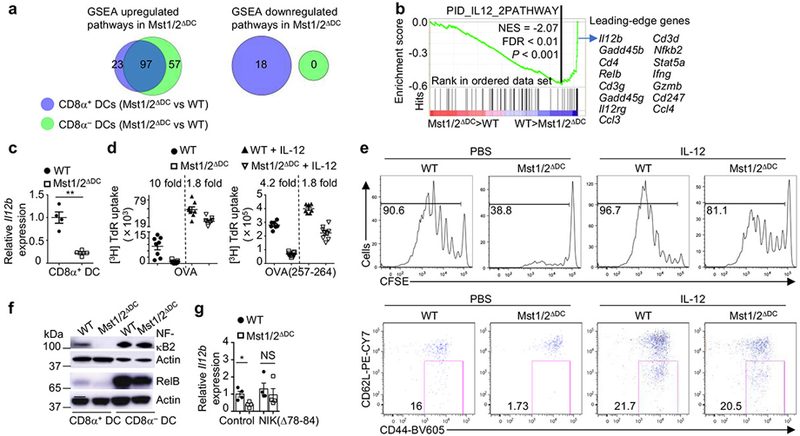
a, Venn diagram showing the overlap of significantly upregulated or downregulated pathways by GSEA analysis between CD8α+ and CD8α− DCs. b, Underrepresentation of IL-12 pathway in Mst1/2-deficient CD8α+ DCs. NES, normalized enrichment score. c, Il12b expression in CD8α+ DCs from WT and Mst1/2ΔDC mice (n = 4 per genotype). d, Thymidine incorporation of OT-I T cells cultured with OVA protein- or OVA(257-264) peptide-pulsed CD8α+ DCs with or without IL-12 (left, n = 8 from 3 WT mice, n = 9 from 3 Mst1/2ΔDC mice; right, n = 7 from 3 WT mice, n = 9 from 3 Mst1/2ΔDC mice). The numbers above the graph are the relative ratios of WT vs Mst1/2ΔDC DC groups. e, CFSE dilution (left) and CD62L/CD44 expression (right) of transferred OT-I T cells in OVA-immunized mice. f, NF-κB2 (p100) and RelB expression in DCs. g, Relative Il12b expression in WT or Mst1/2-deficient CD24high FLT3L-BMDCs transduced with control or NIK(Δ78-84) (n = 4 mice per group). Error bar indicates SEM. *P < 0.05; **P < 0.01; two-tailed unpaired Student’s t-test in c, g. Data summarize two (c–f) or three (g) independent experiments.