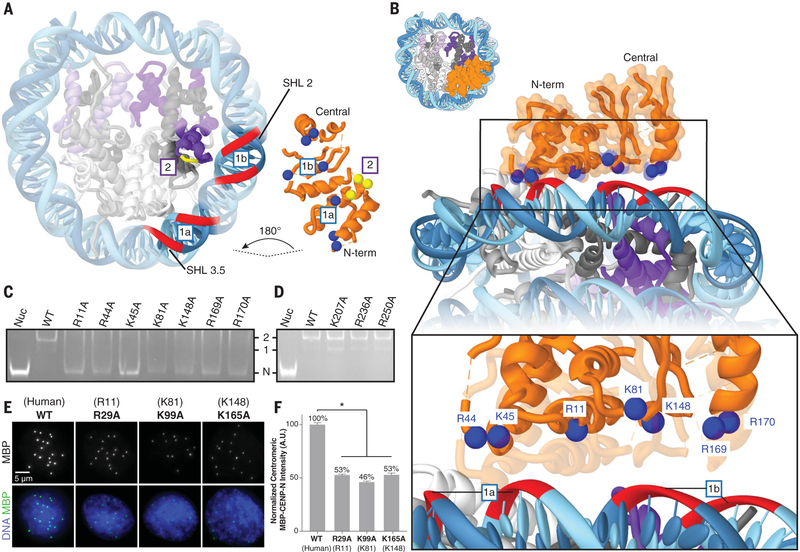
Fig. 2. Interaction of CENP-N with nucleosomal DNA.
(A) Cut-away view of the hCENP-N1–286/CENP-A nucleosome model to highlight interfaces involved in complex formation (see also fig. S11, A and B). For the CENP-N/DNA interface (labeled “1a” and “1b”), nucleosomal DNAis shown as a red ribbon, whereas positively charged residues of CENP-N that are proposed to interact with it are shown as blue spheres. Forthe CENP-N/CENP-A interface (labeled “2”), CENP-A residues (R80, G81, and V82) are marked by the short yellow ribbon, whereas interacting CENP-N residues (E3, T4, and E7) are shown as yellow spheres. (B) View of the CENP-N/DNA interface at different magnifications to highlight details of interactions between the nucleosomal DNA and positively charged residues of CENP-N. (C) Gel mobility shift experiment to examine the effects of CENP-N mutations (indicated atop the gel) on binding to the CENP-A nucleosome. Impaired binding is reflected by increased intensity of the free nucleosome (Nuc) band, concomitant with the disappearance of defined 1:1 and 2:1 bands. “N” indicates the migration position of the free CENP-A nucleosome; “1” and “2” denote the migration positions of CENP-A nucleosomes bound with either one or two molecules of CENP-N, respectively. WT, wild type. (D) Similar analysis to that in (C), carried out with a set of CENP-N mutations involving residues distal from the binding interface. (E) Images of interphase nuclei in Xenopus egg extracts with exogenous MBP-xCENP-N and xCENP-L proteins containing the indicated mutations (with analogous human mutations in parentheses), stained with an antibody forMBP (green) and Hoechst (blue). (F) Centromeric MBP fluorescence intensity normalized as a percentage of that observed for wild-type MBP-xCENP-N. Error bars represent SEM (n > 200 centromeres). A.U., arbitrary units.

