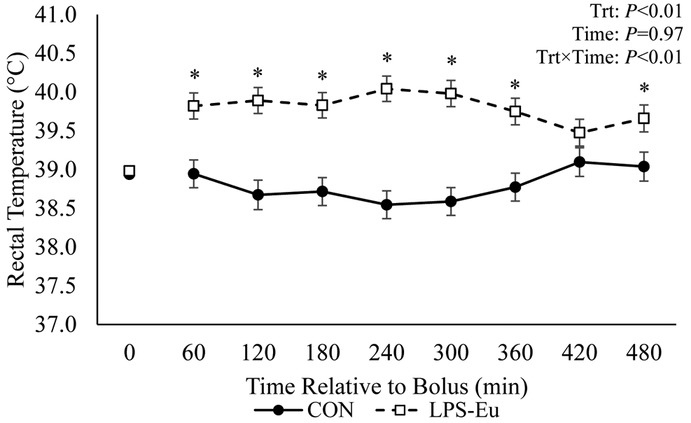
Figure 1.

Rectal temperature in pigs administered a bolus of saline (control [CON]) or lipopolysaccharide challenge + euglycemic clamp [LPS-Eu]. Results are expressed as least squares means ± SEM. Time 0 represents an average of measurements taken −30, −20, and 0 min relative to bolus administration. *Denotes treatment differences (P < 0.05) at the indicated time point. Trt = treatment.
