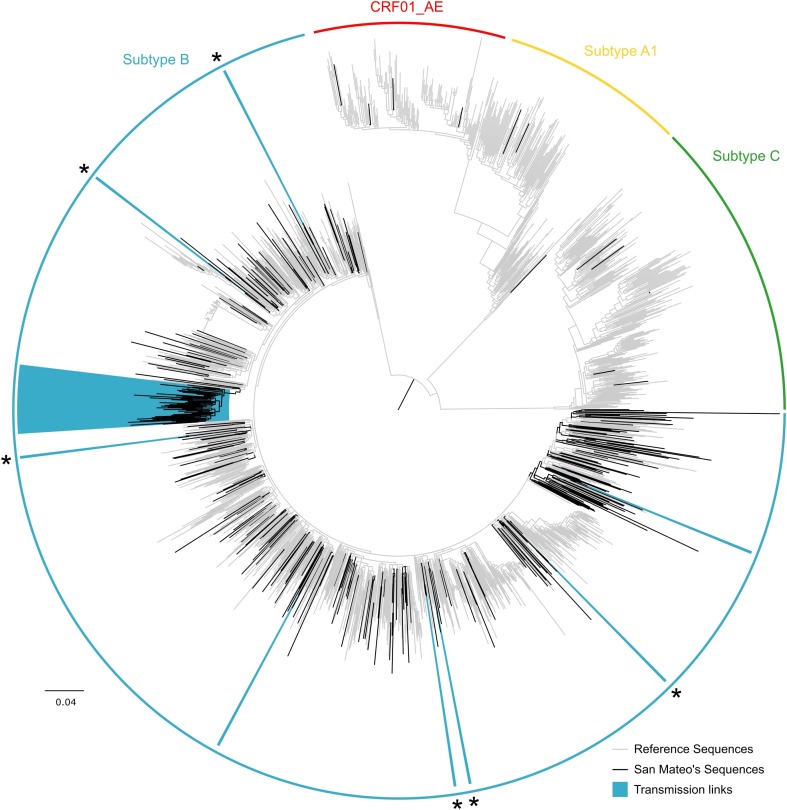
FIGURE 1.
Maximum likelihood HIV-1 pol transmission clusters in San Mateo County, California. Colored semi-circles indicate HIV subtypes. Black branches represent sequences obtained from 316 HIV-positive adults receiving antiretroviral treatment as part of the publicly funded San Mateo County AIDS Program. Gray branches denote reference sequences. Clades highlighted in blue indicate transmission clusters identified in Cluster Picker (TBE ≥ 90 and genetic distance threshold of 8%). Asterisks indicate transmission pairs mutually identified as transmission links in Cluster Picker and HIV-TRACE. The scale bar at the bottom represents the number of substitutions per site along branches in the tree topology.

