
Figure 2.
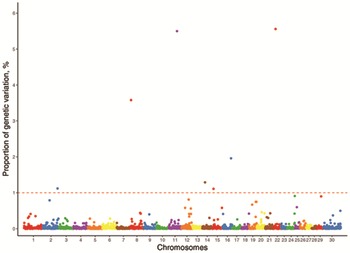
Manhattan plot of the genomewide association study for pregnancy in Nellore heifers. The dashed red line represents the threshold of the proportion of the explained genetic variance.
Official websites use .gov
A
.gov website belongs to an official
government organization in the United States.
Secure .gov websites use HTTPS
A lock (
) or https:// means you've safely
connected to the .gov website. Share sensitive
information only on official, secure websites.
Manhattan plot of the genomewide association study for pregnancy in Nellore heifers. The dashed red line represents the threshold of the proportion of the explained genetic variance.