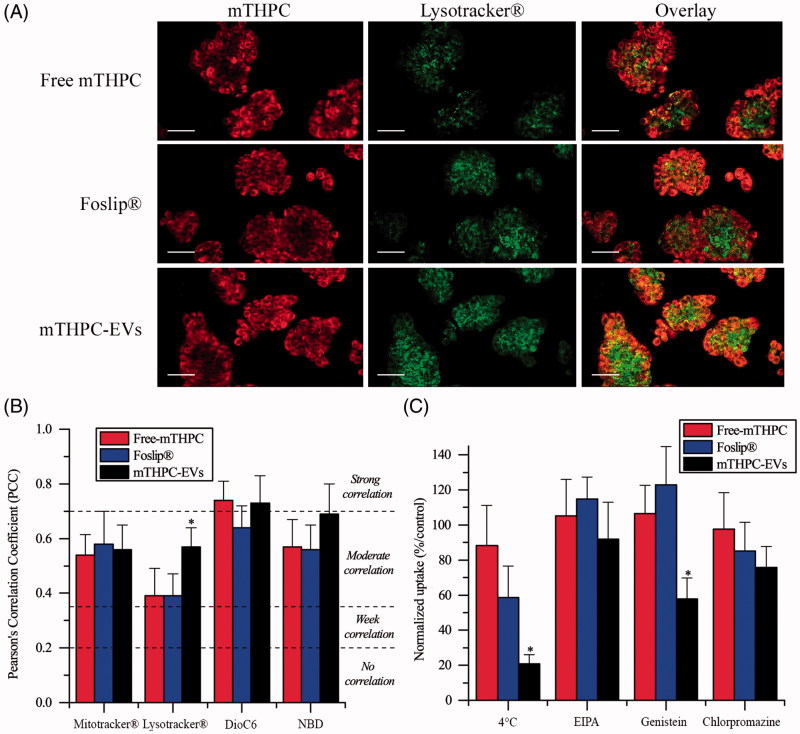
Figure 3.
(A) Typical confocal images HT29 cells costaining with different mTHPC formulations (1.45 µM) and Lysotracker®. Left panel displays mTHPC images, center panel displays Lysotracker® images and right panel displays overlay images. These images were representative of three independent experiments. Scale bar: 50 µm (B) PCC values obtained from overlay images. (C) Endocytosis pathways inhibition of cellular uptake of mTHPC formulations after incubation at 4 °C or 37 °C with endocytosis inhibitors. *: p < .05 compared to free and liposomal mTHPC.

