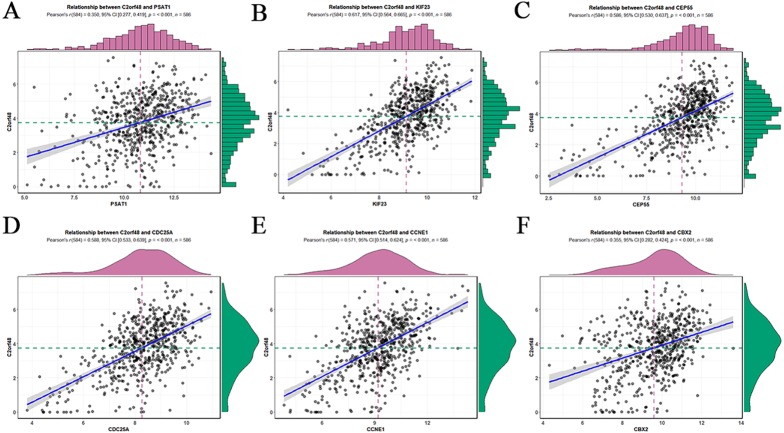
Figure 3. Regression analysis between the expression levels of DElncRNAs and DEmRNAs targeted by hsa-mir-195.
(A) Regression analysis between the expression levels of C2orf48 and PSAT1. (B) Regression analysis between the expression levels of C2orf48 and KIF23. (C) Regression analysis between the expression levels of C2orf48 andCEP55. (D) Regression analysis between the expression levels of C2orf48 and CDC25A. (E) Regression analysis between the expression levels of C2orf48 and CCNE1. (F) Regression analysis between the expression levels of C2orf48 and CBX2. The horizontal axis indicates mRNA expression, and the vertical axis indicates lncRNA expression. (Pearson’s r, correlation coefficient.) The upper and right edges are histograms of gene expression.

