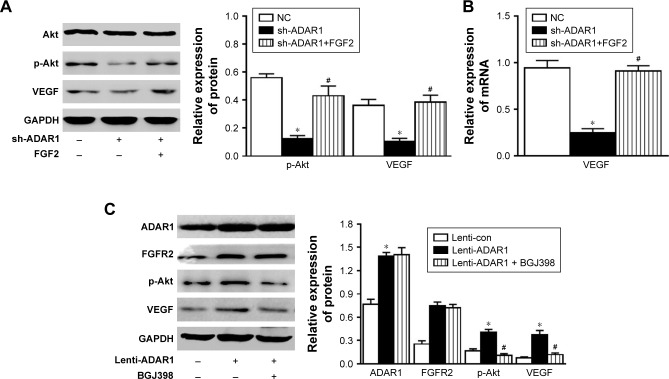
Figure 5.
ADAR1 and FGFR2 activate PI3K pathway.
Notes: (A) Western blot and quantification analysis of PI3K pathway proteins in sh-ADAR1 cells as well as sh-ADAR1 cells treated by FGF2. Qualitative results were normalized to GAPDH. *P<0.05, as compared to the control; #P<0.05, as compared to sh-ADAR1. (B) Relative mRNA level of VEGF in sh-ADAR1 cells. Results were normalized to NC. Values are expressed as mean ± SE. *P<0.05, as compared to the control; #P<0.05, as compared to sh-ADAR1. (C) Western blot and quantification of PI3K pathway proteins in ADAR1 overexpressing cells and cells treated with BGJ398. Data represented as mean ± SEM of 3 independent experiments. *P<0.05, as compared to the control; #P<0.05, as compared to lenti-ADAR1.
Abbreviations: ADAR1, adenosine deaminase acting on RNA 1; FGFR2, fibroblast growth factor receptor 2; NC, negative control; VEGF, vascular endothelial growth factor.

