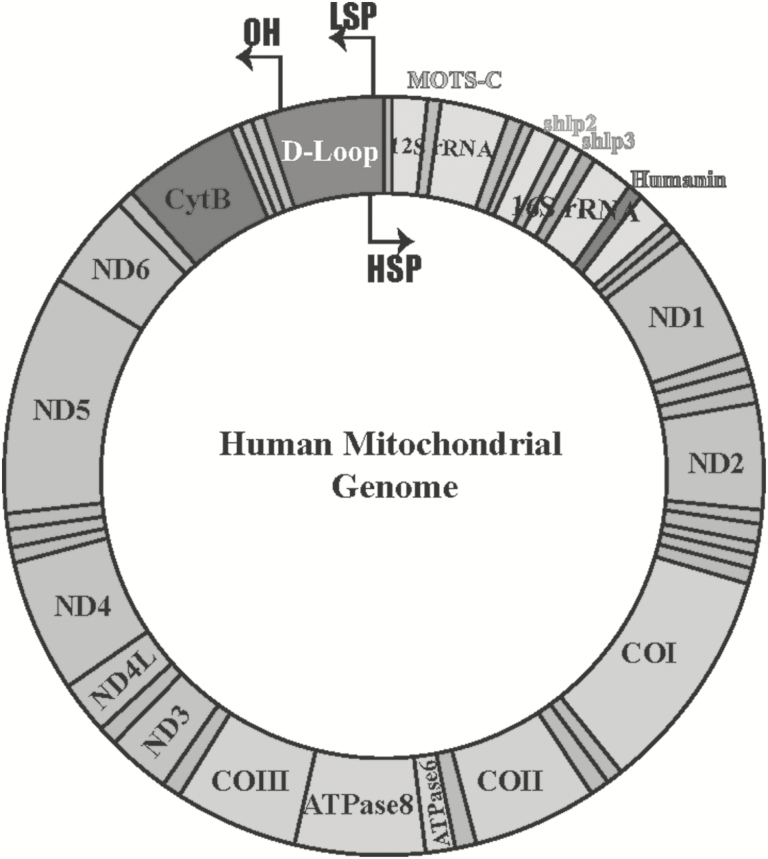
Figure 1.
The human mitochondrial genome. Relative locations of genes are represented as colored blocks including humanin (red), MOTS-c (blue), small humanin-like peptide 2 (SHLP 2) and SHLP3 (orange and green, respectively). Twenty-two tRNAs encoded from mitochondria are represented as teal-colored bands. HSP, heavy strand promoter; LSP, light strand promoter; OH, origin of heavy strand synthesis.

