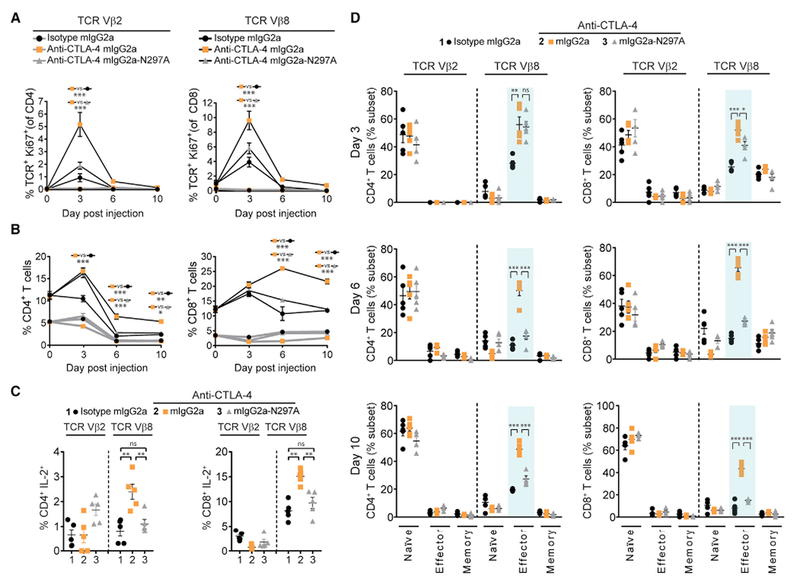
Figure 2. Antigen-Specific T Cell Responses Enhanced by Anti-CTLA-4 mAb Require Intact FcγR Co-engagement.

(A and B) Proliferation (Ki67+) of SEB-specific (Vβ8+, black lines) and non-specific (Vβ2+, gray lines) T cells (A) and the percentage of Vβ8+ and Vβ2+ T cells (B) evaluated by flow cytometry in the peripheral blood pre- (day 0) and post-treatment (days 3, 6, and 10) of C57BL/6 mice administered i.p. with 150 μg of SEB together with a 100-μg dose of anti-CTLA-4 mAb or mIgG2a isotype control mAb (n = 5 mice/group). A two-way ANOVA was used to calculate significance.
(C and D) Intracellular flow cytometry for IL-2 produced by Vβ8+ and Vβ2+ T cells on day 6 post-SEB/mAb administration (C) and naive (CD44− CD62L+), effector (CD44+ CD62L+) and memory (CD44+ CD62L+) T cells represented as a percentage of the total Vβ8+ or Vβ2+ T cell fraction (D) in the samples in (A and B). A Student’s t test was used to calculate significance.
Data are representative of three or more experiments. Error bars indicate SEM; ns, not significant; *p < 0.05; **p < 0.01; ***p < 0.001. See also Figure S2.
