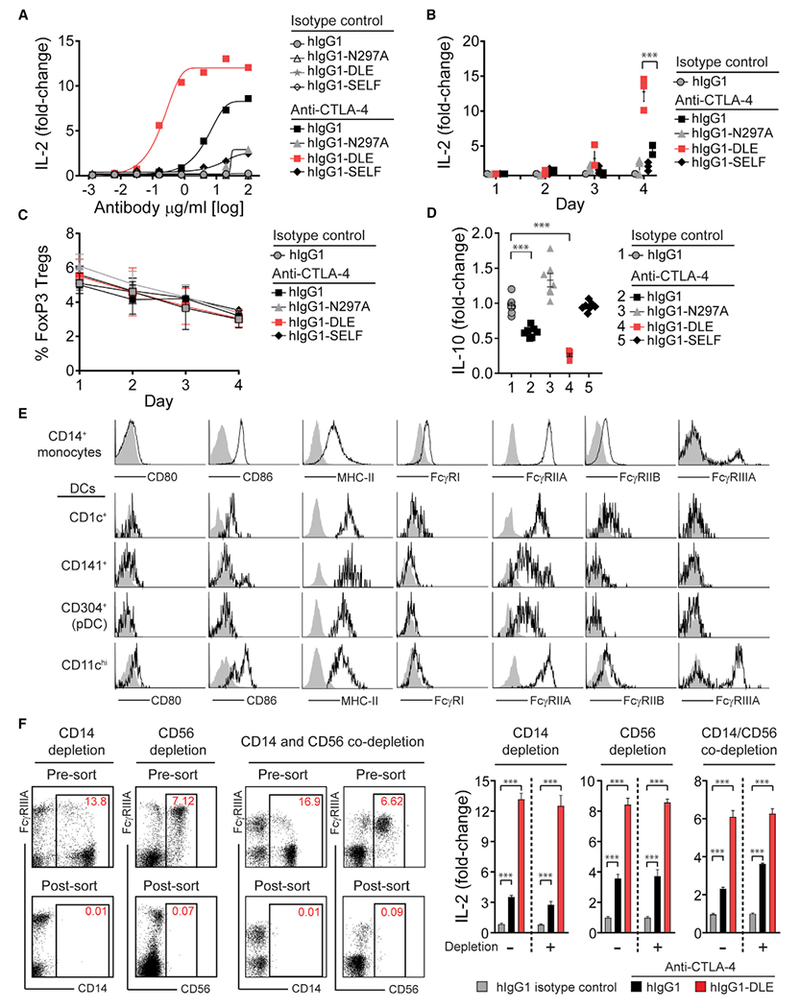
Figure 5. Improved Functionality of Anti-CTLA-4 mAb with Fc Engineering.

(A) IL-2 production (day 4) by human PBMCs stimulated with 100 ng/mL of SEA peptide together with anti-CTLA-4 mAb variants or corresponding hIgG1 isotype control mAbs.
(B and C) Kinetics of PBMC IL-2 production (B) and FoxP3+ Treg cell frequency (C) following stimulation with SEA peptide and the anti-CTLA-4 hIgG1 mAb variants in (A) or hIgG1 isotype control (10 μg/mL).
(D) IL-10 production by human PBMCs following stimulation with SEA peptide and the anti-CTLA-4 hIgG1 mAb variants in (A) or hIgG1 isotype control (10 μg/mL).
(E) Representative flow cytometry profiles of CD80, CD86, MHC class II, and FcγRs on PBMC-derived CD14+ monocytes or lineage-negative CD14− dendritic cell populations.
(F) Representative flow cytometry plots and associated IL-2 production (day 4) from PBMCs with or without depletion of CD14+, CD56+, or co-depletion of CD14+ and CD56+ cells prior to stimulation with SEA peptide and anti-CTLA-4 mAbs (hIgG1 or hIgG1-DLE) or hIgG 1 isotype control (10 μg/mL).
Fold-change in cytokine production (IL-2 or IL-10) was calculated relative to a no mAb control (A, B, D, and F). Data are representative of three or more experiments. A Student’s t test was used to calculate significance in (B–D and F). Error bars indicate SEM; ***p < 0.001. See also Figure S5.
