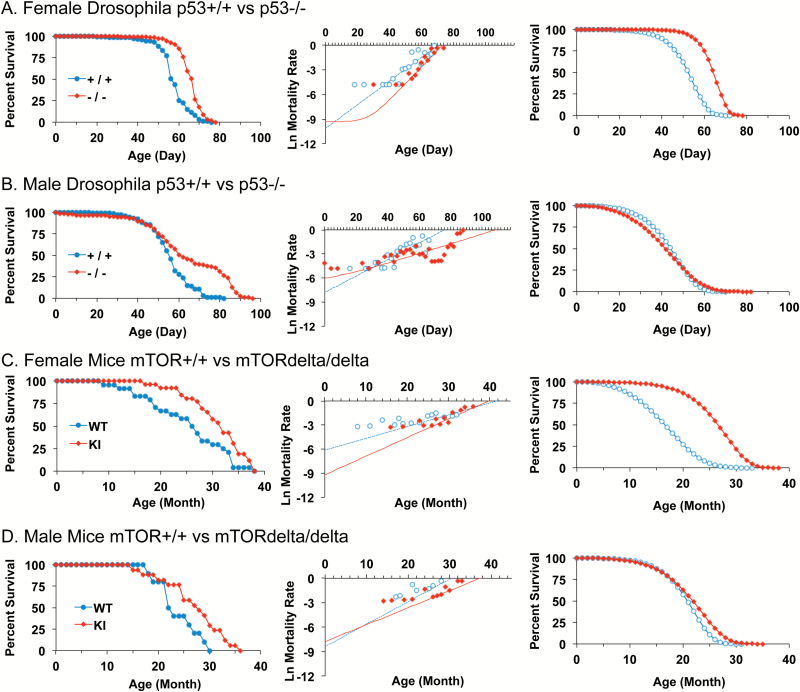
Figure 2.
Drosophila p53 null mutation and mouse mTOR hypomorphic mutation have sex-specific effects on mortality rates. (A–D) Left panel, raw survival data. Center panel, plot of natural log mortality rate versus time, and trend line for data fitted to the G-M model. Right panel, reconstructed survival curves for data fitted to the Gompertz model. Statistical summary in Table 1. (A) Female Drosophila p53+/+ versus p53−/−. (B) Male Drosophila p53+/+ versus p53−/−. (C) Female Mice mTOR+/+ (WT) versus mTORdelta/delta (KI). (D) Male Mice mTOR+/+ (WT) versus mTORdelta/delta (KI).

