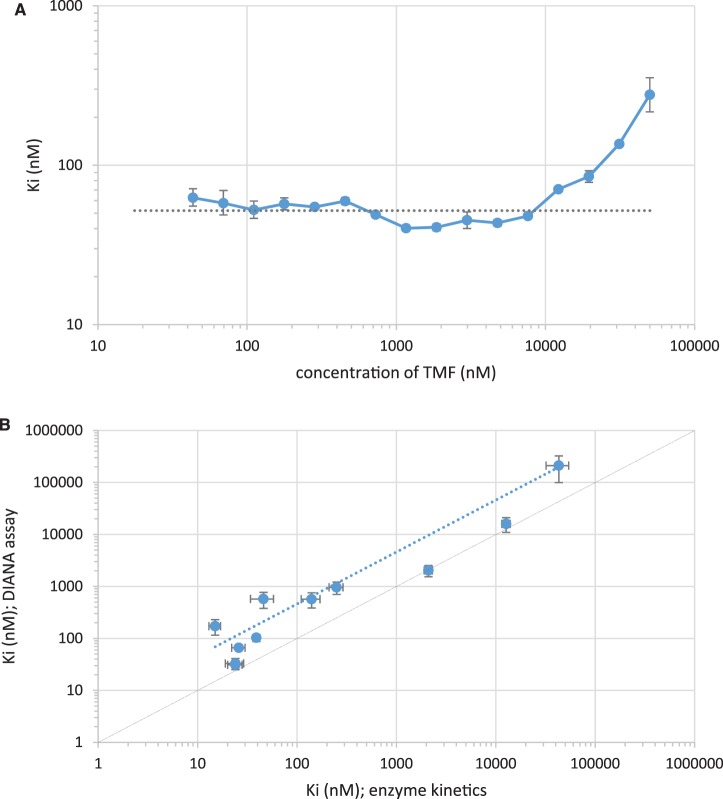
Figure 5. Determination of inhibition constants from a single inhibitor concentration by DIANA (A) and comparison with kinetic measurement (B).
(A) Serially diluted tamiphosphor (TMF, x-axis) was tested using DIANA, and Ki values were calculated from each data point (y-axis). The dashed horizontal line shows the average Ki calculated as the mean of Ki values determined from concentrations of tamiphosphor in the 43 nM to 12 µM range. Error bars indicate the standard error of mean from two independent experiments. Both axes are shown as log-scales. (B) Plot of Ki values of 11 neuraminidase inhibitors determined either by kinetic measurement (fluorometric assay; x-axis) or by DIANA (y-axis). Error bars indicate the standard error of mean from two independent experiments. Both axes are shown as log-scales. The diagonal solid line represents a 1 : 1 ratio of values from both methods. The dashed line is the linear regression of the Ki values determined by both methods (Ki values determined by DIANA were on average 4-fold higher than those determined by the kinetic assay).

