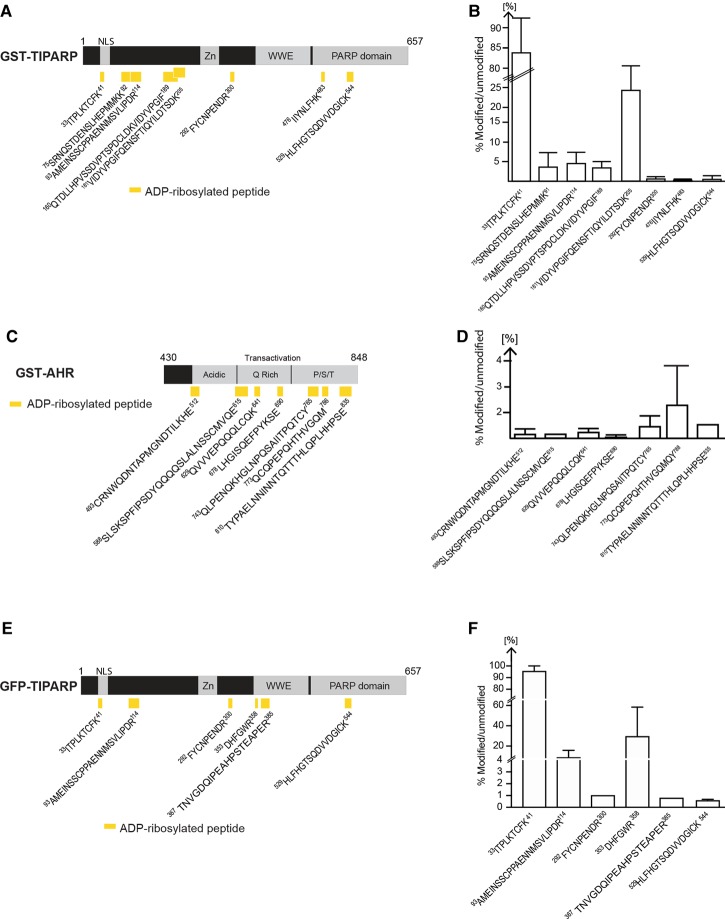
Figure 8. ADP-ribosylated peptides in bacterially expressed GST-TIPARP.
(A) Schematic representation of the domain structure of TIPARP and the location of the ADP-ribosylated peptides (yellow rectangles) identified by MS in GST-TIPARP. Peptide sequences are numbered according to the unmodified full-length protein. (B) Mono-ADP-ribosylated peptides in GST-TIPARP show varying levels of ADP-ribosylation. (C) Schematic representation of the domain structure of AHR and the location of the ADP-ribosylated peptides (yellow rectangles) identified by MS in GST-AHR. (D) Mono-ADP-ribosylated peptides in AHR show varying levels of ADP-ribosylation. (E) Schematic representation of the domain structure of TIPARP and the location of the mono-ADP-ribosylated peptides (yellow rectangles) identified by MS in immunoprecipitated GFP-TIPARP. (F) ADP-ribosylated peptides in GFP-TIPARP show varying levels of ADP-ribosylation. The bar graphs (B,D,F) show the relative abundance of the ADP-ribosylated peptides. The percentage of modified versus unmodified peptide was calculated from the total peptide population that represents all peptide forms including peptide forms with sequence overlap due to missed trypsin cleavage sites, sodium adducts, and oxidized forms. Data are expressed as means ± SEM from at least two independent experiments.

