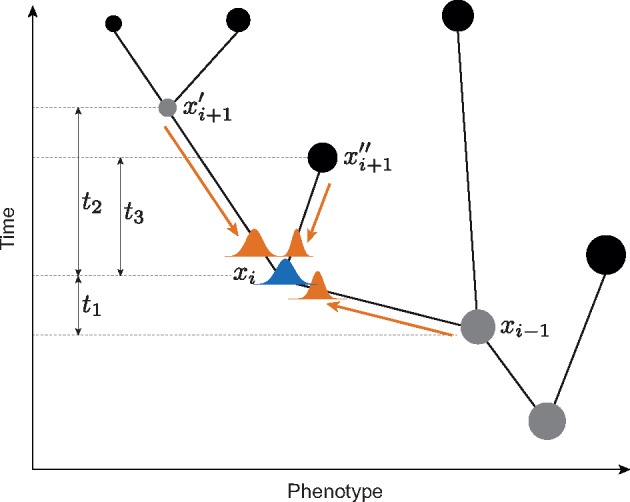
Figure 1.

Posterior density of ancestral states. Ancestral states at the internal nodes of the tree are sampled directly from their posterior distribution, which combines three normal densities: two from the descendants and one from the parent node (all of which are based on the current trait states and parameters of the BM model), resulting in a normal posterior distribution (blue graph). The notation follows that of Eq. 2.
